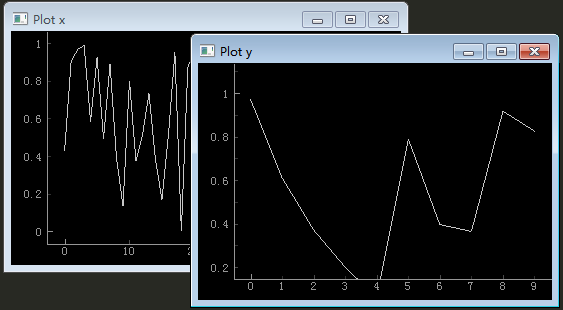
使用PyQtGraph绘制图形(1)
首先利用numpy模块创建两个随机数组,用来作为图形绘制的数据:
import pyqtgraph as pg
import numpy as np
from pyqtgraph.Qt import QtCore


x = np.random.random(50)
y = np.random.random(10)
z = np.r_[x,y]
使用Plot()绘制曲线:
def pg_plot():
    win = pg.GraphicsLayoutWidget(show=True)
    p1 = win.addPlot(title = 'Plot x')
    p1.plot(x)
    pg.exec()

接下来把数据y的曲线也绘制出来:

可以看到x,y分别在不同的窗口,如何把两条曲线绘制在同一个窗口呢?
def pg_plot():
    win = pg.GraphicsLayoutWidget(show=True)
    p1 = win.addPlot(title = 'Plot x and y')
    p1.plot(x,pen = 'g')
    p1.plot(y,pen = 'r')
    pg.exec()

用这种方法还可以添加更加的曲线


 浙公网安备 33010602011771号