vue2 antv x6 入门 (一)画布、节点、边
安装
# npm
npm install @antv/x6 --save

# yarn
yarn add @antv/x6
1. 初始化画布
<div id="container"></div>
import { Graph } from '@antv/x6'

const graph = new Graph({
  container: document.getElementById('container'),
  width: 800,
  height: 600,
  background: {
    color: '#F2F7FA',
  },
})
2、渲染节点和边
X6 支持 JSON 格式数据
该对象中
nodes 代表节点数据,
edges 代表边数据,
可以使用 attrs 属性来定制节点和边的样式(可以类比 CSS)。
3、画布添加节点、边
创建data1.js文件
const data = {
  nodes: [
    {
      id: 'node1',  // id唯一标识
      shape: 'rect',
      x: 40,
      y: 40,
      width: 100,
      height: 40,
      label: 'hello',
      attrs: {
        // body 是选择器名称,选中的是 rect 元素
        body: {
          stroke: '#8f8f8f', //边的颜色
          strokeWidth: 1, // 边线宽
          fill: '#fff', // 背景颜色,跟选择相关,如果是文字fill代表是字体颜色
          rx: 6, // 圆角弧数
          ry: 6, // 圆角弧数
        },
      },
    },
    {
      id: 'node2',
      shape: 'rect',
      x: 160,
      y: 180,
      width: 100,
      height: 40,
      label: 'world',
      attrs: {
        body: {
          stroke: '#8f8f8f',
          strokeWidth: 1,
          fill: '#fff',
          rx: 6,
          ry: 6,
        },
      },
    },
  ],
  edges: [
    {
      shape: 'edge',
      source: 'node1',
      target: 'node2',
      label: 'x6',
      attrs: {
        // line 是选择器名称,选中的边的 path 元素
        line: {
          stroke: '#8f8f8f',
          strokeWidth: 1,
        },
      },
    },
  ],
}

export default data
页面使用 json数据
graph.fromJSON(data) // 渲染元素
graph.centerContent() // 居中显示
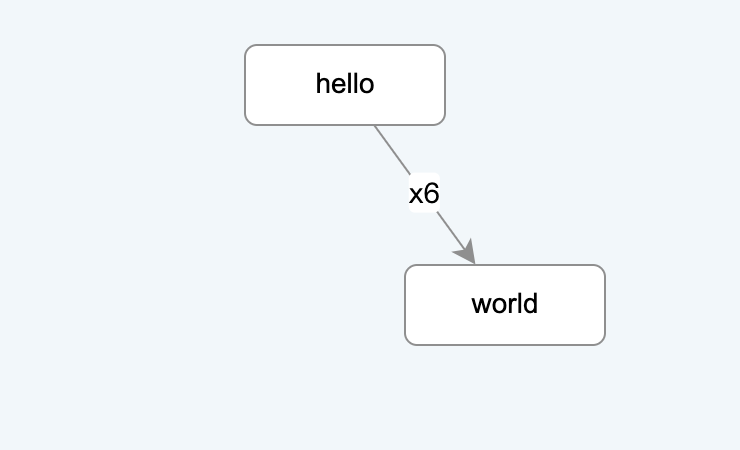
效果

页面代码
<template>
  <div>
    <div id="container"></div>
  </div>
</template>
<script>
import { Graph } from '@antv/x6'
import dataJSON from './data1'
export default {
  name: 'index2Page',
  data() {
    return {
      graph: null
    }
  },
  mounted() {
    this.initGraph()
  },
  methods: {
    initGraph() {
      this.graph = new Graph({
        container: document.getElementById('container'),
        width: 800,
        height: 600,
        background: {
          color: '#F2F7FA'
        }
      })
      console.log(dataJSON)
      this.graph.fromJSON(dataJSON) // 渲染元素
    this.graph.centerContent() // 居中显示

    }
  }
}
</script>
这里是重点:
X6 支持使用 SVG、HTML 来渲染节点内容,在此基础上,我们还可以使用 React、Vue 组件来渲染节点,这样在开发过程中会非常便捷。在拿到设计稿之后,你就需要权衡一下使用哪一种渲染方式,可以参考下面的一些建议:
- 如果节点内容比较简单,而且需求比较固定,使用
SVG节点 - 其他场景,都推荐使用当前项目所使用的框架来渲染节点
1、使用svg渲染节点
- 节点和边都有共同的基类 Cell,除了从 Cell 继承属性外,还支持以下选项。
| 属性名 | 类型 | 默认值 | 描述 |
|---|---|---|---|
| x | number | 0 | 节点位置 x 坐标,单位为 px |
| y | number | 0 | 节点位置 y 坐标,单位为 px |
| width | number | 1 | 节点宽度,单位为 px |
| height | number | 1 | 节点高度,单位为 px |
| angle | number | 0 | 节点旋转角度 |
graph.addNode({
  shape: 'rect',
  x: 100,
  y: 40,
  width: 100,
  height: 40,
})
二、内置节点
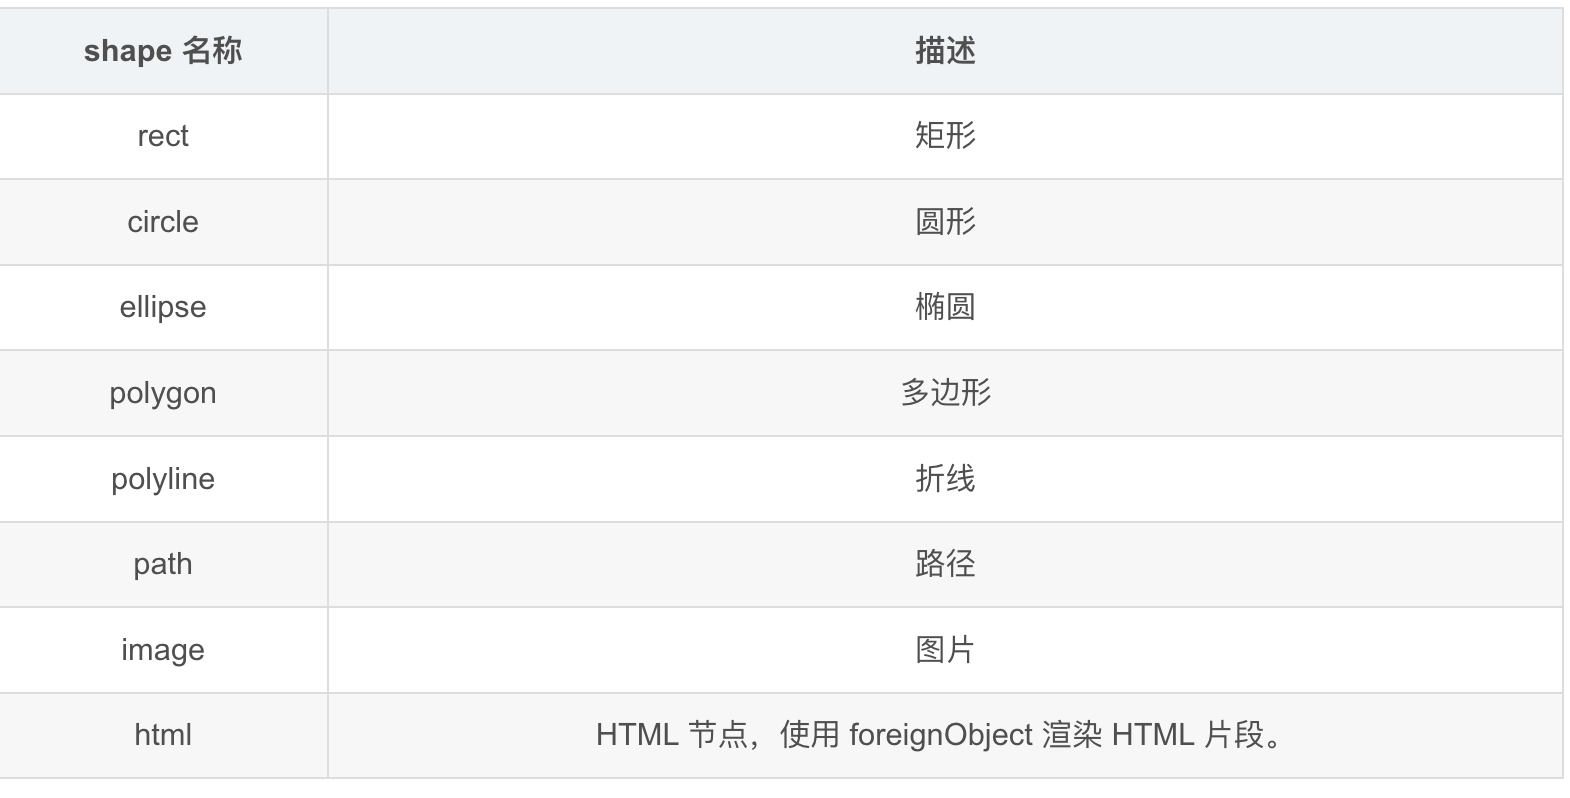
使用 shape 指定节点的图形,shape 的默认值为 rect。X6 内置节点与 shape 名称对应关系如下表

graph.addNode({
    shape: "rect",
    x: 40,
    y: 40,
    width: 80,
    height: 40,
    label: "rect",
});
三、定制节点
markup 和 attrs 来定制节点的形状和样式,markup 可以类比 HTML,attrs 类比 CSS。
Rect.config({
  width: 100,
  height: 40,
  markup: [  //  定义了节点由 <rect> 和 <text> 两个 SVG 元素构成,并分别指定了 body 和 label 两个选择器,接着就可以在 attrs 中通过这两个选择器来指定节点的默认样式。
    {
      tagName: 'rect',
      selector: 'body',
    },
    {
      tagName: 'text',
      selector: 'label',
    },
  ],
  attrs: {
    body: {
      fill: '#ffffff',
      stroke: '#333333',
      strokeWidth: 2,
    },
    label: {
      fontSize: 14,
      fill: '#333333',
      refX: '50%',
      refY: '50%',
      textAnchor: 'middle',
      textVerticalAnchor: 'middle',
    },
  },
})
四、VUE 自定义节点
npm install @antv/x6-vue-shape --save
节点Vue
<template>
  <div class="rounded-corner">
    <div class="content">
      <img :src="require('@/assets/img/4.png')" width="20" alt="" />
      这是一段文字
    </div>
  </div>
</template>

<style scoped>
.rounded-corner {
  background-color: purple;
  height: 50px;
  width: 100px;
  border-radius: 10px;
  display: flex;
  justify-content: center;
  align-items: center;
}

.content {
  color: white;
  font-size: 14px;
}
</style>
主页面 ,引入注册组件及 vue组件
import { register, getTeleport } from '@antv/x6-vue-shape'
import vueNode1 from './node1.vue'
注册节点 - 添加画布
    // 注册vue组件节点
      register({
        shape: 'custom-vue-node',
        x: 200,
        y: 100,
        width: 100,
        height: 50,
        component: vueNode1
      })

      this.graph.addNode({
        id: 'xxfdafds',
        shape: 'custom-vue-node', // 指定使用何种图形,默认值为 'rect'
        x: 200,
        y: 100,
        width: 60,
        height: 60
      })
边线 addEdge 即可
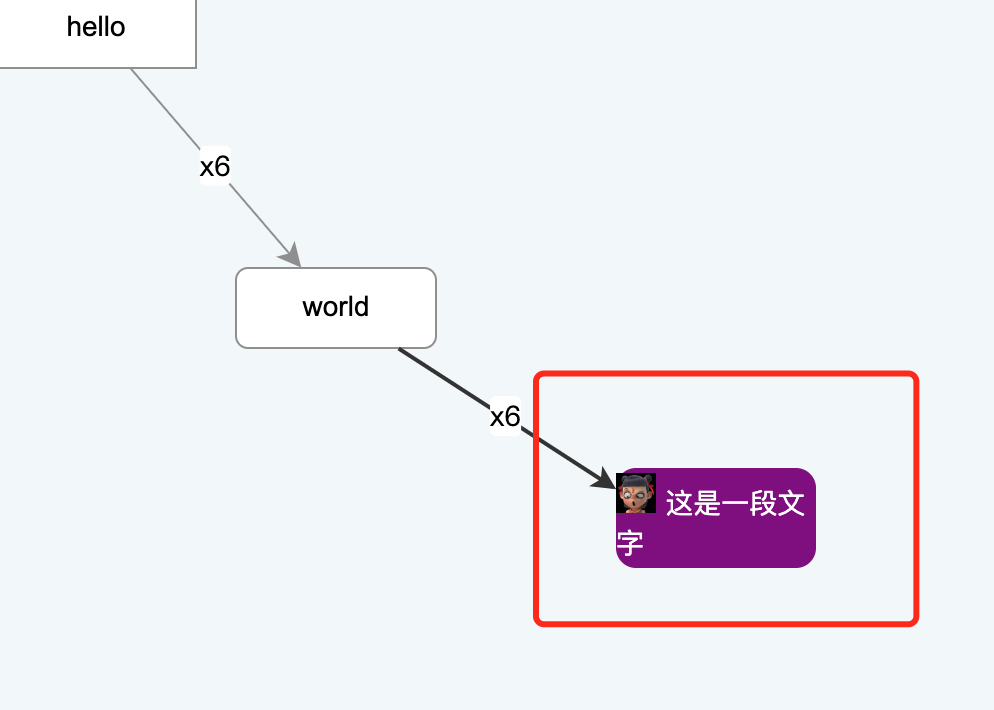
效果:

antx6---参考官网


