机器学习中的优化方法——两种梯度下降法的Python实验报告
1 背景
考虑正则逻辑回归的反对函数(Objection Function of Regularized Logistic Regression):
有两个文本文件,A.txt 和 B.txt,分别包含 \(n\times d\) 的矩阵 \(A=[a_1,...,a_n]^\top\) 和 \(n\) 维向量 \(b=[b_1;...;b_n]\),其中,\(n=2000\),\(d=112\),\(b_i\in\{-1,+1\}\)。给定初始点 \(x_0=0\),在 \(\lambda=0,10^{-6},10^{-3},10^{-1}\) 的条件下,使用两种算法求解问题:
(1) 带回溯线搜索的梯度下降;
(2) 步长不变的梯度下降。
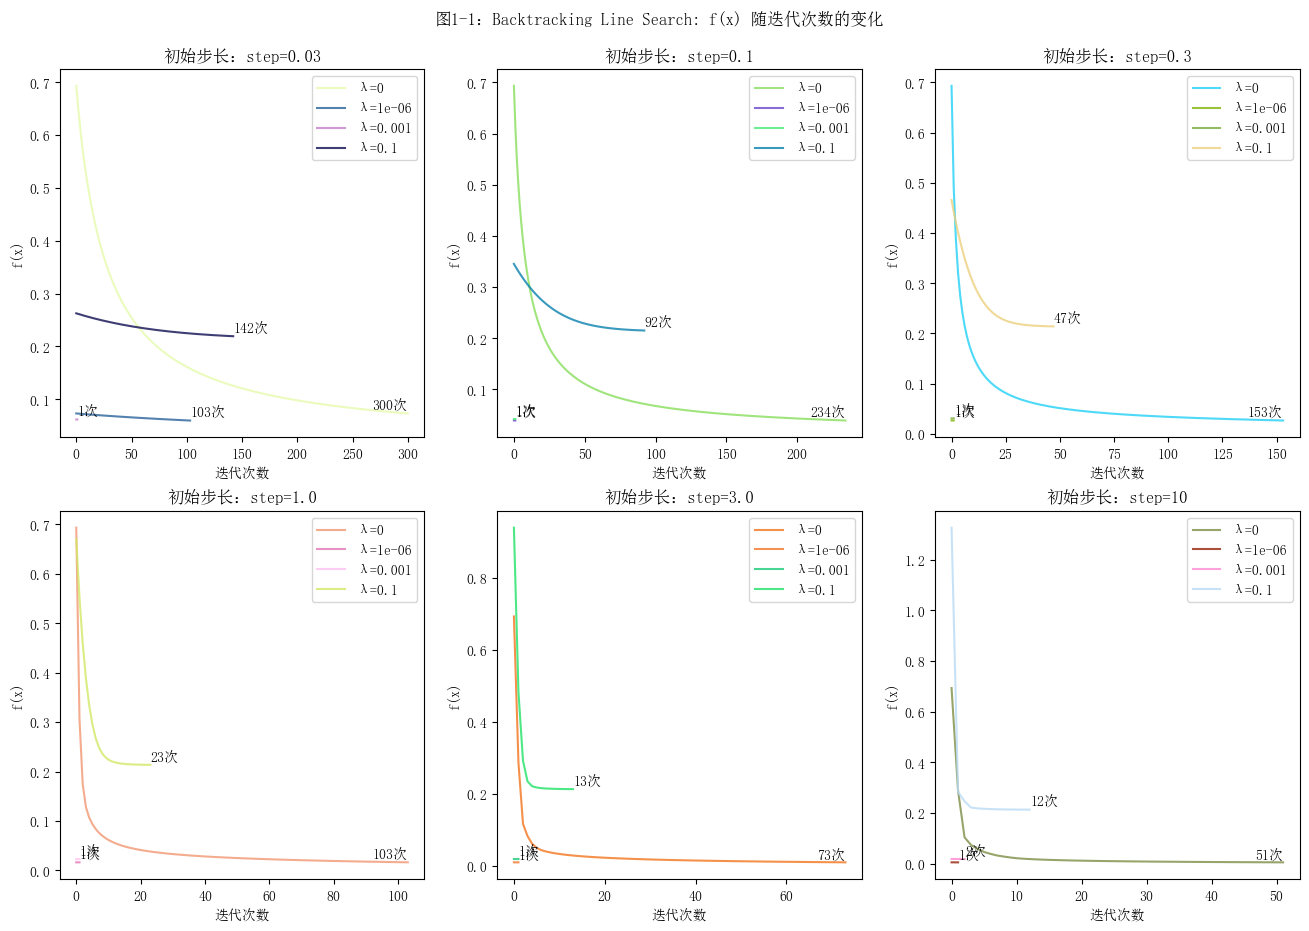
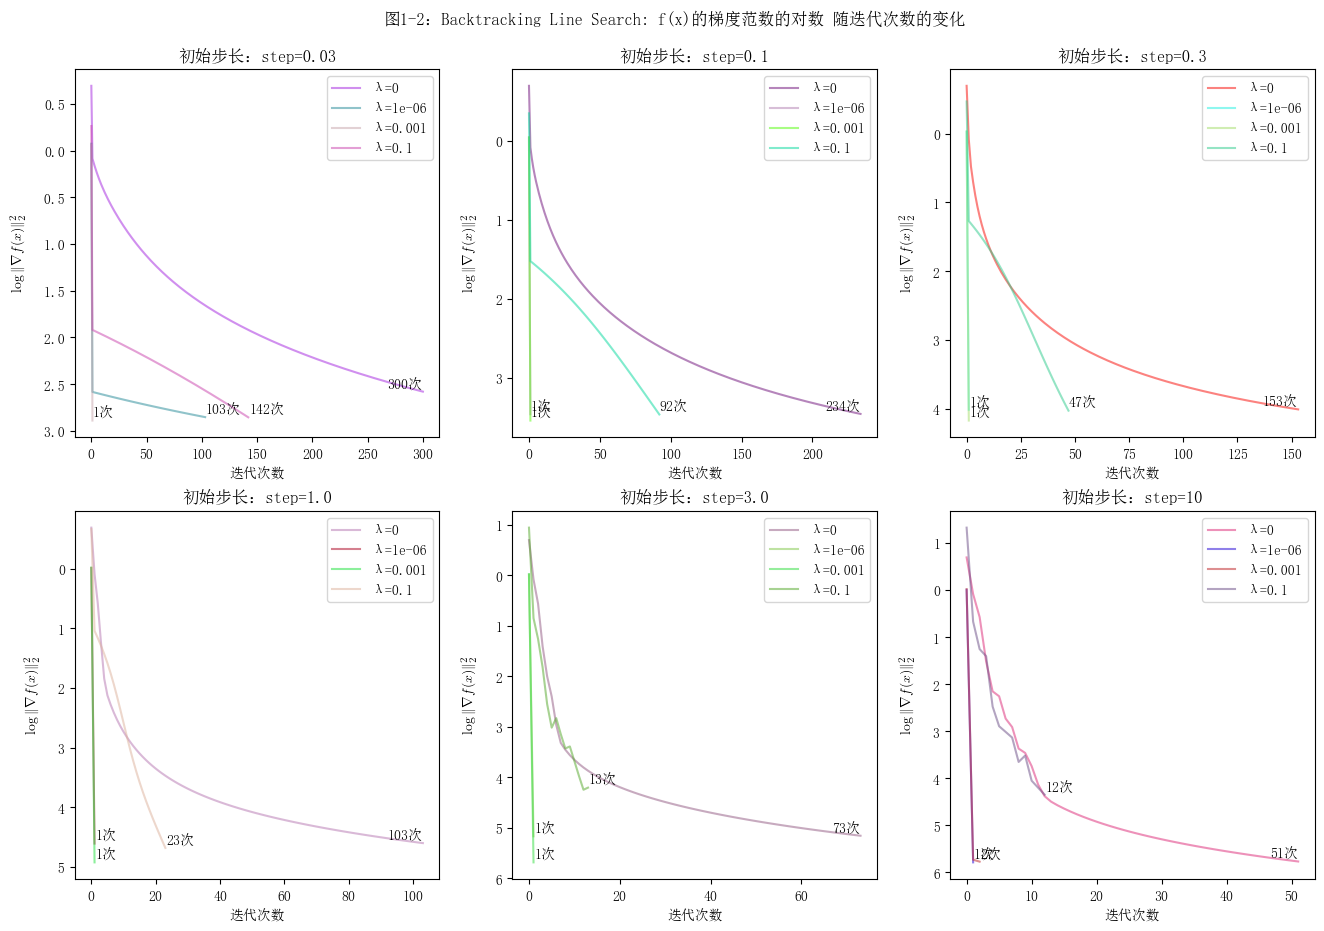
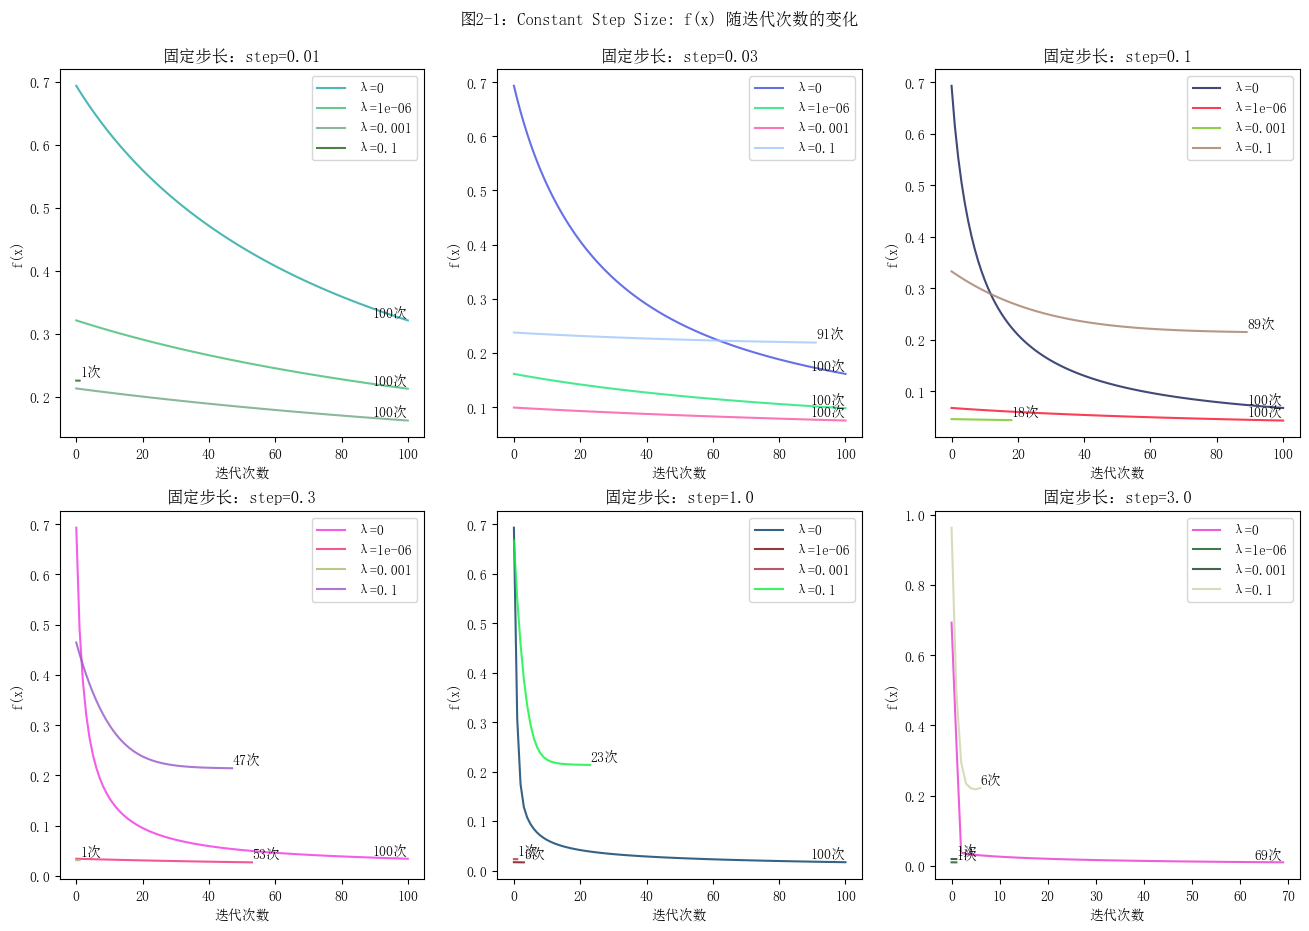
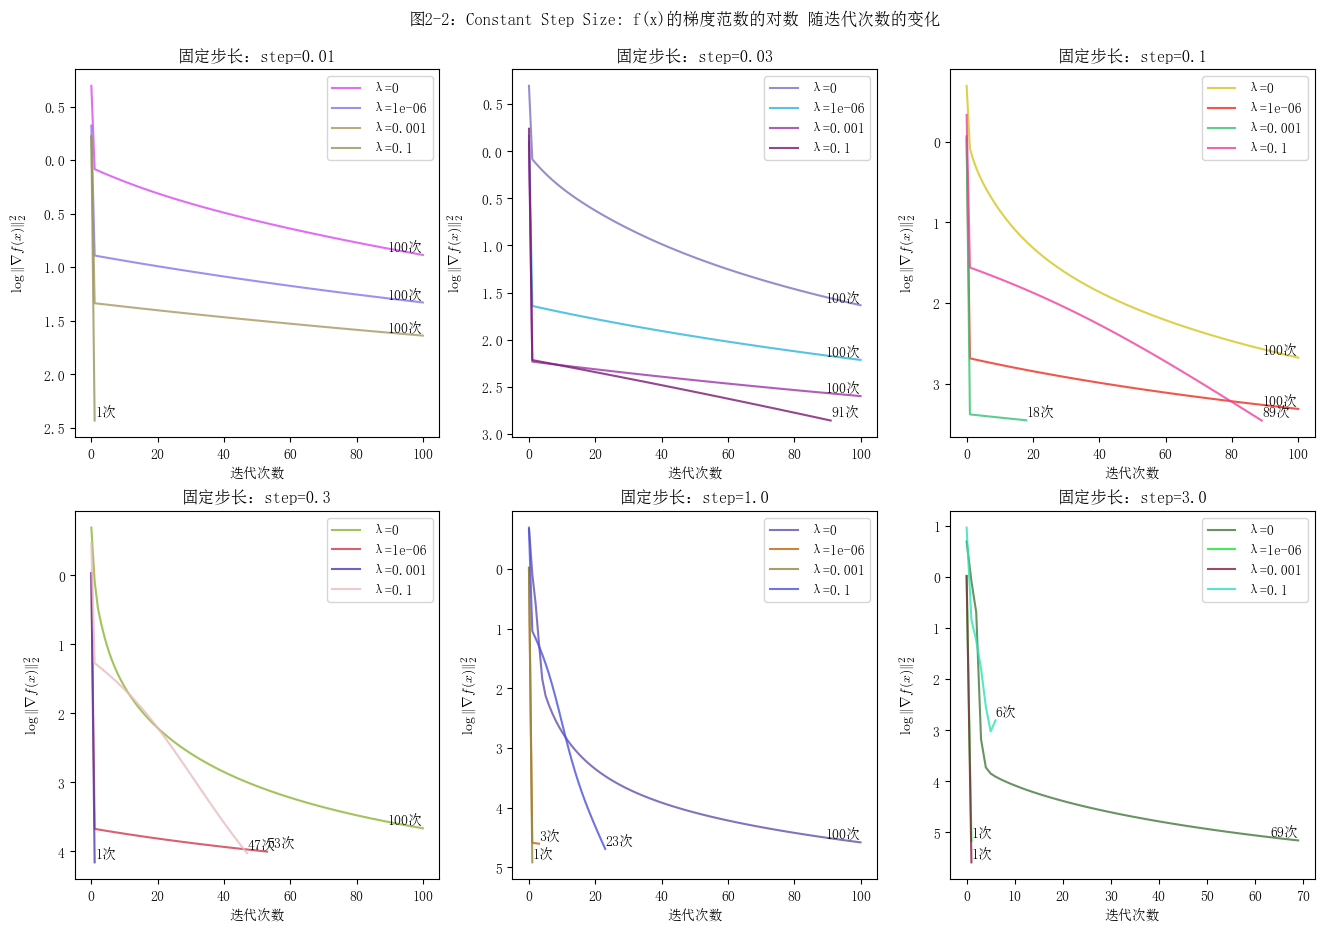
对于每种情况,绘制两幅图:函数值 \(f(x)\) 与迭代次数的关系,以及梯度范数的对数 \(\log \lVert \nabla f(x) \rVert_2\) 与迭代次数的关系。说明如何选择步长,同时,尽量使用矩阵运算,而不是向量或标量运算。
2 实验
2.1 带回溯线搜索的梯度下降
Gradient descent with backtracking line search
算法

代码
import torch

# 从文件加载数据
A = torch.tensor([list(map(float, line.strip().split(','))) for line in open('data/A.txt')], requires_grad=False)
b = torch.tensor([float(line.strip()) for line in open('data/b.txt')], requires_grad=False)

%matplotlib inline
import matplotlib as mpl
import matplotlib.pyplot as plt
import random
from adjustText import adjust_text

mpl.rcParams['font.sans-serif'] = ['SimSun'] # 设置宋体字体,以正常显示中文
plt.figure(figsize=(16, 10)) # 设置图像整体大小

n = 2000
d = 112
lambda_values = [0, 1e-6, 1e-3, 1e-1]
step_values = [0.03, 0.1, 0.3, 1.0, 3.0, 10]
plot_num = len(step_values)

def f(x, lambda_var):
    "The function we want to minimize"
    diag_b = torch.diag(b) # 将 b 升维变成对角矩阵,这样就可以通过矩阵乘法分别得到矩阵的每一项
    first_term = (1/n) * torch.sum(torch.log(1 + torch.exp(torch.mm(torch.mm(-diag_b, A), x))))
    second_term = lambda_var / 2 * torch.norm(x, 2)**2
    return first_term + second_term

def backtracking_line_search(x, lambda_var, id):
    y = f(x, lambda_var)
    curve = [y]
    err = 1.0
    it = 0
    maxIter = 300

    alpha = 0.25 # (0, 0.5]
    beta = 0.8 # (0, 1)

    while err > 1e-4 and it < maxIter:
        it += 1
        x.grad = None  # 清空上一次计算的梯度
        y.backward()  # 计算梯度

        with torch.no_grad():
            # 回溯线搜索算法
            step = step_values[id]
            while f(x - step * x.grad, lambda_var) > y - alpha * step * x.grad.norm()**2:
                step *= beta
            x -= step * x.grad  # 更新 x

        new_y = f(x, lambda_var)
        err = y - new_y
        y = new_y
        # print('err:', err, ', y:', y)
        curve.append(y) # f(x)
        # curve.append(torch.log(torch.norm(x.grad, 2))) # \log \lVert \nabla f(x) \rVert_2^2

    # print('iterations: ', it)

    # 绘制曲线
    iterations = list(range(it + 1))
    curve_values = [value.item() for value in curve]  # 将PyTorch张量转换为NumPy数组

    # 生成随机颜色值
    color = generate_random_color()
    plt.plot(iterations, curve_values, '-', color=color, label='λ={}'.format(format(lambda_var, '.1g')), alpha=0.8)
    labels.append(r'λ=' + format(lambda_var, '.1g'))
    adjust_text([plt.text(iterations[it], curve_values[it], '{}次'.format(it), ha='center', va='bottom')])

# 生成随机颜色值
def generate_random_color():
    r = random.randint(0, 255)
    g = random.randint(0, 255)
    b = random.randint(0, 255)
    return "#{:02x}{:02x}{:02x}".format(r, g, b)

# 画图
for k in range(plot_num):

    # 画子图
    plt.subplot(2, int(plot_num / 2), k + 1)
    labels = [] # 记录不同曲线的标签
    plt.ylabel("f(x)")
    # plt.ylabel(r"$\log \| \nabla {f(x)} \|_2^2$", usetex=True)
    plt.xlabel("迭代次数")
    plt.title("初始步长:step={}".format(step_values[k]))

    # 初始化 x0
    x = torch.zeros((d, 1), requires_grad=True)

    # 对于不同的 λ,调用回溯线搜索梯度下降算法
    for i in range(len(lambda_values)): # λ = 0, 1e-6, 1e-3, 1e-1
        lambda_var = torch.tensor(lambda_values[i], requires_grad=False)
        backtracking_line_search(x, lambda_var, k)

    # 获取当前图形的标签和句柄
    handles, _ = plt.gca().get_legend_handles_labels()
    # 更新图例
    plt.legend(handles, labels)

# 调整子图布局
plt.subplots_adjust(top=0.92)

plt.suptitle("图1-1:Backtracking Line Search: f(x) 随迭代次数的变化")
# plt.suptitle("图1-2:Backtracking Line Search: f(x)的梯度范数的对数 随迭代次数的变化")
plt.show()
绘图


如何选择步长
对比设置了不同初始步长的图像,发现初始步长越小,目标函数值的变化曲线越平缓,收敛的速度越慢。反之,曲线越陡峭,收敛的速度越快,并且其梯度的范数的对数值的波动会更大。对于回溯线搜索梯度下降算法,当初始步长为1.0时,迭代的过程较为稳定。关于步长的确定的方法,可以先按照3倍来调整步长,在确定范围之后再进行微调。
2.2 步长不变的梯度下降
Gradient descent with constant step size
算法

代码
import torch

# 从文件加载数据
A = torch.tensor([list(map(float, line.strip().split(','))) for line in open('data/A.txt')], requires_grad=False)
b = torch.tensor([float(line.strip()) for line in open('data/b.txt')], requires_grad=False)

%matplotlib inline
import matplotlib as mpl
import matplotlib.pyplot as plt
import random
from adjustText import adjust_text

mpl.rcParams['font.sans-serif'] = ['SimSun'] # 设置宋体字体,以正常显示中文
plt.figure(figsize=(16, 10)) # 设置图像整体大小

n = 2000
d = 112
lambda_values = [0, 1e-6, 1e-3, 1e-1]
step_values = [0.01, 0.03, 0.1, 0.3, 1.0, 3.0]
plot_num = len(step_values)

def f(x, lambda_var):
    "The function to minimize"
    diag_b = torch.diag(b) # 将 b 升维变成对角矩阵,这样就可以通过矩阵乘法分别得到矩阵的每一项
    first_term = (1/n) * torch.sum(torch.log(torch.tensor(1) + torch.exp(torch.mm(torch.mm(-diag_b, A), x))))
    second_term = lambda_var / 2 * torch.norm(x, 2)**2
    return first_term + second_term

def gradient_descent(x, lambda_var, id):
    times = 100  # 迭代次数
    step = step_values[id]  # 步长 (==0.05时无法收敛而报错,然后在调整为0.01之后,调回0.05又不报错了。。玄学)

    y = f(x, lambda_var)
    curve = [y]

    # 梯度下降算法
    for i in range(times):
        x.grad = None  # 清空上一次计算的梯度
        y.backward()  # 计算梯度

        with torch.no_grad():
            x -= step * x.grad

        new_y = f(x, lambda_var)
        err = y - new_y
        y = new_y
        # print("第%d次迭代:err=%f, f(x)=%f" % (i + 1, err, new_y))
        # curve.append(y)
        curve.append(torch.log(torch.norm(x.grad, 2))) # \log \lVert \nabla f(x) \rVert_2^2

        if err < 1e-4: # 在达到一定精度时停止迭代
            times = i + 1
            break

    # 准备坐标点
    iterations = list(range(times + 1))
    curve_values = [value.item() for value in curve]  # 将PyTorch张量转换为NumPy数组

    # 生成随机颜色值
    color = generate_random_color()
    # 绘制曲线
    plt.plot(iterations, curve_values, '-', color=color, label='λ={}'.format(format(lambda_var, '.1g')), alpha=0.8)
    labels.append(r'λ=' + format(lambda_var, '.1g'))
    adjust_text([plt.text(iterations[times], curve_values[times], '{}次'.format(times), ha='center', va='bottom')])

# 生成随机颜色值
def generate_random_color():
    r = random.randint(0, 255)
    g = random.randint(0, 255)
    b = random.randint(0, 255)
    return "#{:02x}{:02x}{:02x}".format(r, g, b)

if __name__ == "__main__":

    # 进行梯度下降计算并画图
    for k in range(plot_num):

        # 画子图
        plt.subplot(2, int(plot_num / 2), k + 1)
        labels = [] # 记录不同曲线的标签(λ=?)
        # plt.ylabel("f(x)")
        plt.ylabel(r"$\log \| \nabla {f(x)} \|_2^2$", usetex=True)
        plt.xlabel("迭代次数")
        plt.title("固定步长:step={}".format(step_values[k]))

        # 初始化 x0
        x = torch.zeros((d, 1), requires_grad=True)

        # 对于不同的 λ,调用固定步长的梯度下降算法
        for i in range(len(lambda_values)): # λ = 0, 1e-6, 1e-3, 1e-1
            lambda_var = torch.tensor(lambda_values[i], requires_grad=False)
            gradient_descent(x, lambda_var, k)

        # 获取当前图形的标签和句柄
        handles, _ = plt.gca().get_legend_handles_labels()
        # 更新图例
        plt.legend(handles, labels)

    # 调整子图布局
    plt.subplots_adjust(top=0.92)

    # plt.suptitle("图2-1:Constant Step Size: f(x) 随迭代次数的变化")
    plt.suptitle("图2-2:Constant Step Size: f(x)的梯度范数的对数 随迭代次数的变化")

    plt.show()
绘图


如何选择步长
可以按照3倍的关系,依次尝试不同的步长来确定范围。在本实验中,对于固定步长的梯度下降算法,其步长在0.1到1.0之间时,函数能够相对较快地收敛,且收敛过程较为平滑。
3 日志
3.1 找不到 .tfm 文件
报错:
FileNotFoundError: Matplotlib's TeX implementation searched for a file named 'cmr10.tfm' in your texmf tree, but could not find it
解决方法:
[Input]:
import matplotlib as mpl
mpl.get_cachedir()
[Output]:
'C:\\Users\\S1362\\.matplotlib'
删除该目录下的文件即可。参考:matplotlib库问题汇总。
3.2 找不到 latex
报错:
RuntimeError: Failed to process string with tex because latex could not be found
解决方法:在系统上安装 latex 环境 + 玄学。
3.3 matplotlib 不显示中文
解决方法:参考文章。

