vue3封装Echarts为Vue组件
一、创建Charts.vue组件
<template>
  <div class="container" ref="container"></div>
</template>

<script setup>
import {onMounted, ref,defineProps,watch,toRefs} from 'vue'
import * as echarts from 'echarts'// 引入echarts

const props = defineProps({
  options:{
    type:Object,
    default:{},
    required:true
  },
  theme:{
    type:String,
    default:"",//dark为深色模式
    required:false
  }
})
const {options} = toRefs(props)
const container = ref(null)
const chart = ref(null)

//组件挂载后将echarts挂载在container上,并将给echarts设置传入的options
onMounted(()=>{
  chart.value = echarts.init(container.value,props.options.theme)
  chart.value.setOption(props.options)
})

//监听options发生变化时,重新给echarts设置传入的options
watch(options,(newOptions)=>{
  chart.value.setOption(newOptions)
},
{deep:true}
)
</script>
<style scoped>
.container {
  width:100%;
  height: 100%;
}
</style>
二、使用Charts组件
在需要显示echarts的页面引入Charts.vue并传入options参数,已官网实例为例
<template>
<div class="chart">
<Chart :options="options"/>
</div>
</template>
<script setup>
import { reactive } from 'vue'
import Chart from '@/components/chart/Chart.vue'
const options = reactive({
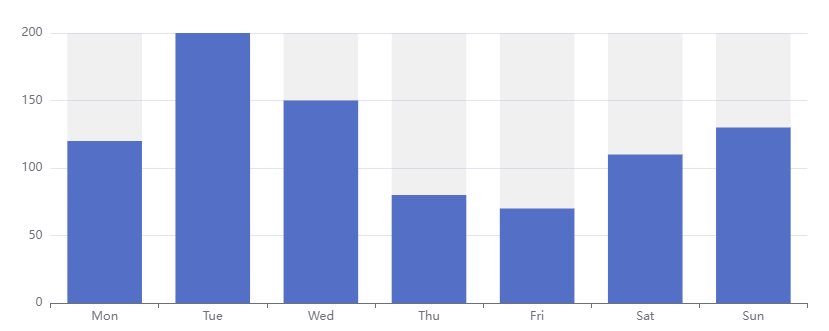
xAxis: {
type: 'category',
data: ['Mon', 'Tue', 'Wed', 'Thu', 'Fri', 'Sat', 'Sun']
},
yAxis: {
type: 'value'
},
series: [
{
data: [120, 200, 150, 80, 70, 110, 130],
type: 'bar',
showBackground: true,
backgroundStyle: {
color: 'rgba(180, 180, 180, 0.2)'
}
}
]
})
</script>
<style scoped>
//注意 echarts 要求必须设置宽高才能正常绘制。
.chart {
width: 400px;
height: 400px;
}
</style>


 浙公网安备 33010602011771号