

餐E评echarts
所需要的数据结构
option = {
num:1212,//商圈数
numRate:34%,//商圈增长率
activation:1231,//活跃度
activationRate:23%,//活跃度增长
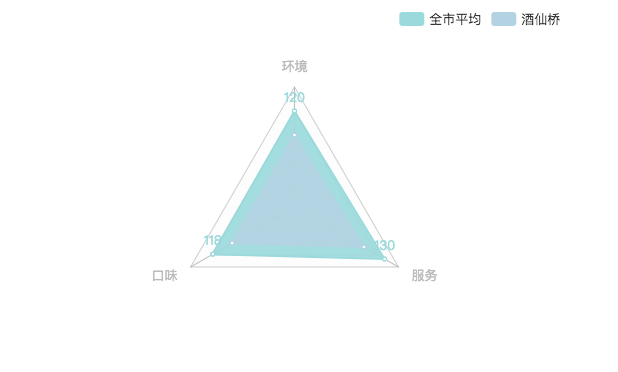
legend:['全市平均','酒仙桥'],
series : [{
data:[120, 118, 130]
},
{
data:[120, 118, 130]
},
]
}
<!DOCTYPE html>
<html lang="en">
<head>
	<meta charset="UTF-8">
	<title>Document</title>
	<script src="https://cdn.bootcss.com/echarts/3.7.1/echarts.js"></script>
</head>
<body>
	<div id="app" style="height: 400px;">
	</div>
	<script>
		var ec = echarts.init(document.querySelector('#app'));
		var option = {
		    title: {
		        text: '自定义雷达图'
		    },
		    legend: {
		    	data: ['全市平均','酒仙桥'],
		        right: '5%'
		    },
		    radar: [
		        {
		            indicator: [
		                { text: '环境', max: 150 },

		                { text: '口味', max: 150 },

		                { text: '服务', max: 150 }
		            ],
		            center: ['75%', '50%'],
		            radius: 120
		        }
		    ],
		    series: [
		        {
		            name: '成绩单',
		            type: 'radar',
		            data: [
		                {
		                    value: [120, 118, 130],
		                    name: '全市平均',
		                    itemStyle : {
		                      normal:{
		                        color:'#9BDADC'
		                      }
		                    },
		                    label: {
		                        normal: {
		                            show: true,
		                            formatter:function(params) {
		                                return params.value;
		                            }
		                        }
		                    },
		                    areaStyle: {
		                        normal: {
		                            opacity: 0.9,
		                            color: new echarts.graphic.RadialGradient(0.5, 0.5, 1, [
		                                {
		                                    color: '#9BDADC',
		                                    offset: 0
		                                },
		                                {
		                                    color: '#9BDADC',
		                                    offset: 1
		                                }
		                            ])
		                        }
		                    }
		                },
		                {
		                    value: [90, 90, 100],
		                    name: '酒仙桥',
		                    itemStyle : {
		                      normal:{
		                        color:'#B3D3E2'
		                      }
		                    },
		                    areaStyle: {
		                        normal: {
		                            opacity: 0.9,
		                            color: new echarts.graphic.RadialGradient(0.5, 0.5, 1, [
		                                {
		                                    color: '#B3D3E2',
		                                    offset: 0
		                                },
		                                {
		                                    color: '#B3D3E2',
		                                    offset: 1
		                                }
		                            ])
		                        }
		                    }
		                }
		            ]
		        }
		    ]
		}
		ec.setOption(option);
	</script>
</body>
</html>

 浙公网安备 33010602011771号