

redflag的echarts结构
总体的市场情况

这里我需要4个data数组。
var list = {
currentData:[],//这里表示当月数据量,数组长度8
totalData:[],//这里表示的累计数据量,数组长度8
currentBasis:[],//这里表示的当月数据量同比,数组长度8
totalBasis:[]//这里表示的累计数据量同比,数组长度8
}
<!doctype html>
<html lang="en">
<head>
  <meta charset="UTF-8" />
  <title>Document</title>
  <script src="https://cdn.bootcss.com/echarts/3.7.1/echarts.js"></script>
</head>
<body>
  <div id="app" style="height:400px">

  </div>
  <script>
    window.myChart = echarts.init(document.querySelector('#app'));
    var option = {
      tooltip : {
        trigger: 'axis',
        axisPointer : {            // 坐标轴指示器,坐标轴触发有效
            type : 'shadow'        // 默认为直线,可选为:'line' | 'shadow'
        }
    },
    legend: {
        data:['当月销量','累计销量','当月销量同比','累计销量同比'],
        right:'5%'
    },
    grid: {
        left: '3%',
        right: '4%',
        bottom: '3%',
        containLabel: true
    },
    xAxis : [
        {
            type : 'category',
            data : ['乘用车','轿车','SUV','MPV','豪华车','豪华轿车','豪华SUV','豪华MPV'],
            axisLabel:{
                //formatter: '{value}%',
                /*formatter:function(e){
                    return window.tools.toThousands(parseInt(e))+"%"
                },*/
                textStyle:{
                    color: '#80848f'
                }
            },
        }
    ],
    yAxis : [
        {
            type : 'value',
            position: 'left',
            axisLabel:{
                //formatter: '{value}%',
                /*formatter:function(e){
                    return window.tools.toThousands(parseInt(e))+"%"
                },*/
                textStyle:{
                    color: '#80848f'
                }
            },
        },
        {
            axisLabel:{
                //formatter: '{value}%',
                /*formatter:function(e){
                    return window.tools.toThousands(parseInt(e))+"%"
                },*/
                textStyle:{
                    color: '#80848f'
                }
            },
            splitLine : {
                show: false
            },
            type: 'value',
            position: 'right',
            min:0.2,
            max:2
        }
    ],

    series : [
        {
            name:'当月销量',
            type:'bar',
            data:[320, 332, 301, 334, 390, 330, 320,310],
            barWidth: '20%',
            itemStyle:{
                normal:{
                    color:'#3cd8c0'
                }
            },
            label: {
                normal: {
                    show: true,
                    position: 'top',
                    textStyle:{
                        color:'#3cd8c0'
                    },
                    /*formatter:function(e){
                        e.data = window.tools.toThousands(parseInt(e.data));
                        e.data = e.data+"%";
                        return e.data;
                    }*/
                }
            }
        },
        {
            name:'累计销量',
            type:'bar',
            data:[862, 1018, 964, 1026, 1679, 1600, 1570, 1400],

            barGap: '20%',//两个柱之间的距离 或者距离前面的距离
            barWidth: '20%',
            itemStyle:{
                normal:{
                    color:'#3790f8'
                }
            },
            label: {
                normal: {
                    show: true,
                    position: 'top',
                    textStyle:{
                        color:'#3790f8'
                    },
                    /*formatter:function(e){
                        e.data = window.tools.toThousands(parseInt(e.data));
                        e.data = e.data+"%";
                        return e.data;
                    }*/
                }
            }
        },
        {
            name:'当月销量同比',
            type:'line',
            animationDuration: 2200,
            yAxisIndex:1,
            itemStyle:{
                normal:{
                    color:'#fc6363',
                }
            },
            label: {
                normal: {
                    show: true,
                    position: 'top',
                    textStyle:{
                        color:'#fc6363'
                    },
                    /*formatter:function(e){
                        e.data = window.tools.toThousands(parseInt(e.data));
                        e.data = e.data+"%";
                        return e.data;
                    }*/
                }
            },
            smooth: true,
            data: [0.862, 1.018, 0.964, 1.026, 1.679, 1.600, 1.570, 1.32]
        },
        {
            name:'累计销量同比',
            type:'line',
            animationDuration: 2200,
            yAxisIndex:1,
            itemStyle:{
                normal:{
                    color:'#a37ffa',
                }
            },
            label: {
                normal: {
                    show: true,
                    position: 'top',
                    textStyle:{
                        color:'#a37ffa'
                    },
                    /*formatter:function(e){
                        e.data = window.tools.toThousands(parseInt(e.data));
                        e.data = e.data+"%";
                        return e.data;
                    }*/
                }
            },
            smooth: true,
            data: [1.862, 0.318, 1.964, 0.226, 0.679, 0.600, 0.570, 1.5]
        }
    ]
    }
    window.myChart.setOption(option, true);
  </script>
</body>
</html>
市场的详细情况
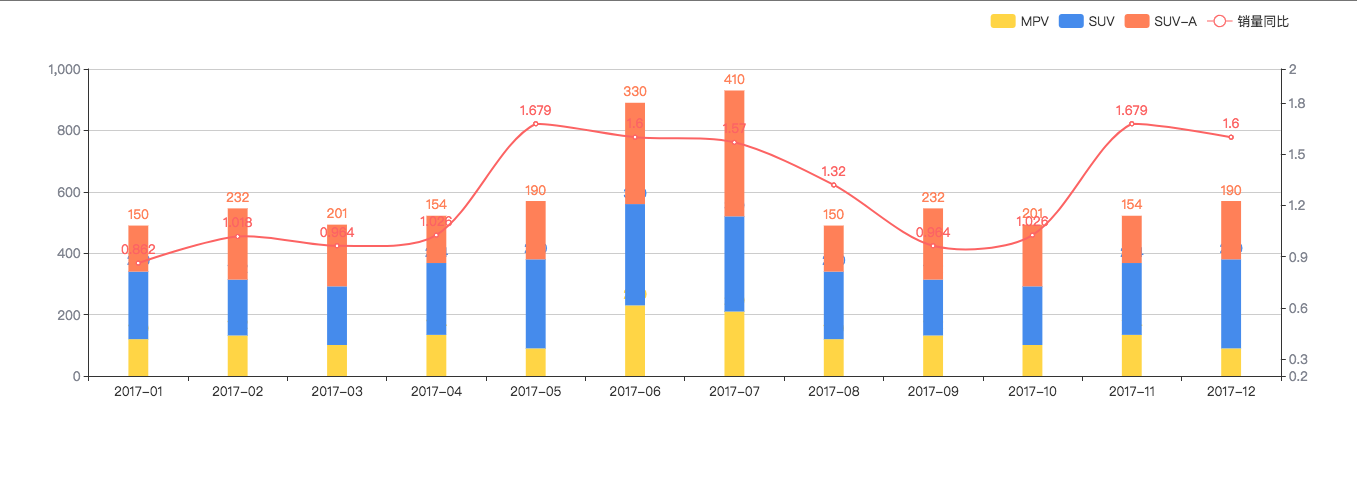
这里需要的数据结构
var option = {
legend:{
data:[]
},
xAxis:{
data:[]
},
series:[
{data:[],name:""},
{data:[],name:""},
{data:[],name:""},
{data:[],name:""} //前边的长度不定,最后一个为 当月销量同比
]
}
<!DOCTYPE html>
<html lang="en">
<head>
<meta charset="UTF-8">
<title>Document</title>
<script src="https://cdn.bootcss.com/echarts/3.7.1/echarts.js"></script>
</head>
<body>
<div id="app" style="height: 400px">
</div>
<script>
window.myChart = echarts.init(document.querySelector('#app'));
var colors = ['#ffd545','#458bec','#ff8058','#fe63cd','#8b62ff'];
var option = {
tooltip : {
trigger: 'axis',
axisPointer : { // 坐标轴指示器,坐标轴触发有效
type : 'shadow' // 默认为直线,可选为:'line' | 'shadow'
}
},
legend: {
data:['MPV','SUV','SUV-A','销量同比'],
right:'5%'
},
grid: {
left: '3%',
right: '4%',
bottom: '3%',
containLabel: true
},
xAxis : [
{
type : 'category',
data : ['2017-01','2017-02','2017-03','2017-04','2017-05','2017-06','2017-07','2017-08','2017-09','2017-10','2017-11','2017-12']
}
],
yAxis : [
{
type : 'value',
position: 'left',
axisLabel:{
//formatter: '{value}%',
/*formatter:function(e){
return window.tools.toThousands(parseInt(e))+"%"
},*/
textStyle:{
color: '#80848f'
}
},
},
{
axisLabel:{
//formatter: '{value}%',
/*formatter:function(e){
return window.tools.toThousands(parseInt(e))+"%"
},*/
textStyle:{
color: '#80848f'
}
},
splitLine : {
show: false
},
type: 'value',
position: 'right',
min:0.2,
max:2
}
],
series : [
{
name:'MPV',
type:'bar',
stack: '广告',
data:[120, 132, 101, 134, 90, 230, 210,120, 132, 101, 134, 90],
barWidth: '20%',
itemStyle:{
normal:{
color: colors[0]
}
},
label: {
normal: {
show: true,
position: 'top',
textStyle:{
color:colors[0]
},
/*formatter:function(e){
e.data = window.tools.toThousands(parseInt(e.data));
e.data = e.data+"%";
return e.data;
}*/
}
}
},
{
name:'SUV',
type:'bar',
stack: '广告',
data:[220, 182, 191, 234, 290, 330, 310,220, 182, 191, 234, 290],
barWidth: '20%',
itemStyle:{
normal:{
color:colors[1]
}
},
label: {
normal: {
show: true,
position: 'top',
textStyle:{
color:colors[1]
},
/*formatter:function(e){
e.data = window.tools.toThousands(parseInt(e.data));
e.data = e.data+"%";
return e.data;
}*/
}
}
},
{
name:'SUV-A',
type:'bar',
stack: '广告',
data:[150, 232, 201, 154, 190, 330, 410,150, 232, 201, 154, 190],
barWidth: '20%',
itemStyle:{
normal:{
color:colors[2]
}
},
label: {
normal: {
show: true,
position: 'top',
textStyle:{
color:colors[2]
},
/*formatter:function(e){
e.data = window.tools.toThousands(parseInt(e.data));
e.data = e.data+"%";
return e.data;
}*/
}
}
},
{
name:'销量同比',
type:'line',
animationDuration: 2200,
yAxisIndex:1,
itemStyle:{
normal:{
color:'#fc6363',
}
},
label: {
normal: {
show: true,
position: 'top',
textStyle:{
color:'#fc6363'
},
/*formatter:function(e){
e.data = window.tools.toThousands(parseInt(e.data));
e.data = e.data+"%";
return e.data;
}*/
}
},
smooth: true,
data: [0.862, 1.018, 0.964, 1.026, 1.679, 1.600, 1.570, 1.32, 0.964, 1.026, 1.679, 1.600]
}
]
};
window.myChart.setOption(option, true);
</script>
</body>
</html>
3.箱线图

需要的数据结构:
var data = {
//指导价格
"directPrice":[[655,850,940,980,1175],[672.5,800,845,885,1012.5],[780,840,855,880,940],[621.25,767.5,815,865,1011.25],[713.75,807.5,810,870,963.75]],
//市场价格
"marketPrice":[[655,850,940,980,1175],[672.5,800,845,885,1012.5],[780,840,855,880,940],[621.25,767.5,815,865,1011.25],[713.75,807.5,810,870,963.75]],
//主销车价 目前为空
"outliers":[[255,268],[456,399]],
"outliersName":[["name1","name2"],["name3","name4"]],
"axisData":["2017-01","2017-02","2017-03","2017-04","2017-05"]
};
<!DOCTYPE html>
<html lang="en">
<head>
	<meta charset="UTF-8">
	<title>Document</title>
	<script src="https://cdn.bootcss.com/jquery/1.11.1-beta1/jquery.js"></script>
	<script src="https://unpkg.com/echarts@3.7.2/dist/echarts-en.min.js"></script>
</head>
<body>
	<div id="app" style="height: 400px;"></div>
	<script>
		var myEcharts = echarts.init(document.querySelector("#app"));
var data = {
	//指导价格
	"directPrice":[[655,850,940,980,1175],[672.5,800,845,885,1012.5],[780,840,855,880,940],[621.25,767.5,815,865,1011.25],[713.75,807.5,810,870,963.75]],
	//市场价格
	"marketPrice":[[655,850,940,980,1175],[672.5,800,845,885,1012.5],[780,840,855,880,940],[621.25,767.5,815,865,1011.25],[713.75,807.5,810,870,963.75]],
	//主销车价 目前为空
	"outliers":[],
	"axisData":["2017-01","2017-02","2017-03","2017-04","2017-05"]
};
		var option = {
		    tooltip: {
		        trigger: 'item',
		        axisPointer: {
		            type: 'shadow'
		        }
		    },
		    legend: {
		        data:['指导价','市场价','主销车价'],
		        right:'5%'
		    },
		    grid: {
		        left: '10%',
		        right: '10%',
		        bottom: '15%'
		    },
		    xAxis: {
		        type: 'category',
		        data: data.axisData,
		        boundaryGap: true,
		        nameGap: 30,
		        splitArea: {
		            show: false
		        },
		        splitLine: {
		            show: false
		        }
		    },
		    yAxis: {
		        type: 'value',
		        splitArea: {
		            show: true
		        }
		    },
		    series: [
		        {
		            name: '指导价',
		            type: 'boxplot',
		            data: data.boxData1,
		            tooltip: {
		                formatter: function (param) {
		                    return [
		                        'Experiment ' + param.name + ': ',
		                        'upper: ' + param.data[4],
		                        'Q3: ' + param.data[3],
		                        'median: ' + param.data[2],
		                        'Q1: ' + param.data[1],
		                        'lower: ' + param.data[0]
		                    ].join('<br/>')
		                }
		            }
		        },
		        {
		            name: '市场价',
		            type: 'boxplot',
		            data: data.boxData2,
		            tooltip: {
		                formatter: function (param) {
		                    return [
		                        'Experiment ' + param.name + ': ',
		                        'upper: ' + param.data[4],
		                        'Q3: ' + param.data[3],
		                        'median: ' + param.data[2],
		                        'Q1: ' + param.data[1],
		                        'lower: ' + param.data[0]
		                    ].join('<br/>')
		                }
		            }
		        },
		        {
		            name: '主销车价',
		            type: 'scatter',
		            data: data.outliers
		        }
		    ]
		};

		myEcharts.setOption(option);
	</script>
</body>
</html>
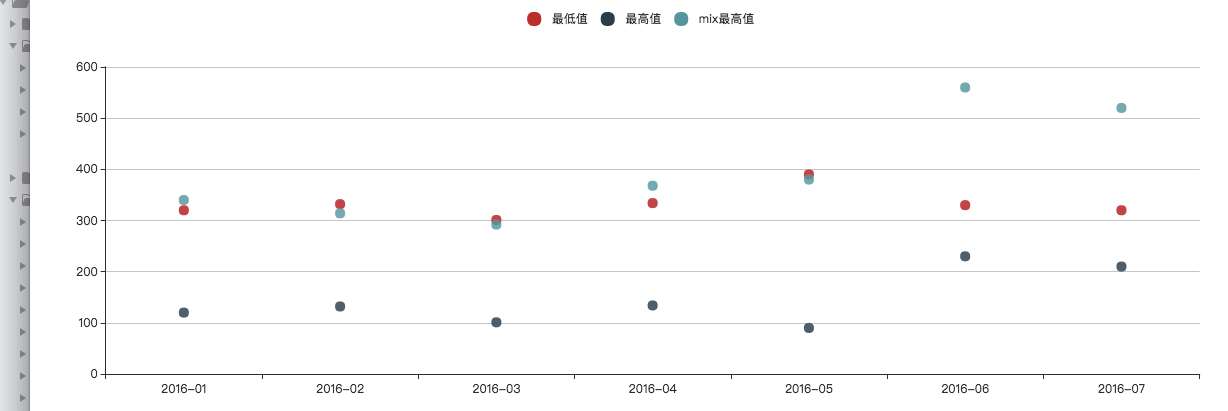


<!DOCTYPE html>
<html lang="en">
<head>
    <meta charset="UTF-8">
    <title>Document</title>
    <script src="https://cdn.bootcss.com/jquery/1.11.1-beta1/jquery.js"></script>
    <script src="https://cdn.bootcss.com/echarts/3.7.2/echarts.min.js"></script>
</head>
<body>
    <div id="app" style="height: 400px;">

    </div>
    <script>
        var app = {};
        app.title = '堆叠柱状图';
        var option = {
            tooltip : {
                trigger: 'axis',
                axisPointer : {            // 坐标轴指示器,坐标轴触发有效
                    type : 'shadow'        // 默认为直线,可选为:'line' | 'shadow'
                }
            },
            legend: {
                data:['最低值','最高值','mix最高值']
            },
            grid: {
                left: '3%',
                right: '4%',
                bottom: '3%',
                containLabel: true
            },
            xAxis : [
                {
                    type : 'category',
                    data : ['2016-01','2016-02','2016-03','2016-04','2016-05','2016-06','2016-07']
                }
            ],
            yAxis : [
                {
                    type : 'value'
                }
            ],
            series : [
                {
                    name:'最低值',
                    type:'scatter',
                    data:[320, 332, 301, 334, 390, 330, 320]
                },
                {
                    name:'最高值',
                    type:'scatter',
                    stack: '广告',
                    data:[120, 132, 101, 134, 90, 230, 210]
                },
                {
                    name:'mix最高值',
                    type:'scatter',
                    stack: '广告',
                    data:[220, 182, 191, 234, 290, 330, 310]
                }
            ]
        };
        var myEcharts = echarts.init(document.querySelector("#app"));
        myEcharts.setOption(option);
    </script>
</body>
</html>
a

 浙公网安备 33010602011771号