
ss 和netstat
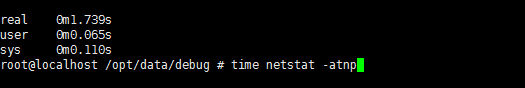
在经行性能测试时, 使用netstat -atn 查看socket 等状态时,总是卡主!!!!
有没有什么快速的办法呢? 通过proc 文件系统? strace netstat发现 也是通过read proc 文件系统 read write输出结果!!!但是 是通过遍历/proc下面每个PID目录
目前看到的是ss 这个工具比netstat快!!
google一下据说用了tcp_diag 啥的导致的!!
ss命令用于PACKET sockets, TCP sockets, UDP sockets, DCCP sockets, RAW sockets, Unix domain sockets等等统计.
ss使用IP地址筛选
ss src ADDRESS_PATTERN
src:表示来源
ADDRESS_PATTERN:表示地址规则
如下:

ss src 120.33.31.1
# 列出来之20.33.31.1的连接
# 列出来至120.33.31.1,80端口的连接
ss src 120.33.31.1:http
ss src 120.33.31.1:8
ss使用端口筛选
ss dport OP PORT
OP:是运算符
PORT:表示端口
dport:表示过滤目标端口、相反的有sport
OP运算符如下:

<= or le : 小于等于 >= or ge : 大于等于
== or eq : 等于
!= or ne : 不等于端口
< or lt : 小于这个端口 > or gt : 大于端口
OP实例

ss sport = :http 也可以是 ss sport = :80
ss dport = :http
ss dport > :1024
ss sport > :1024
ss sport < :32000
ss sport eq :22
ss dport != :22
ss state connected sport = :http
ss ( sport = :http or sport = :https )
ss -o state fin-wait-1 ( sport = :http or sport = :https ) dst 192.168.1/24
netstat不能用ss完全替换。某些netstat命令比ip命令更好
比投入netstat -r netstat -s netstat -i netstat -g 等命令

一般内核都会打卡tcp_diag
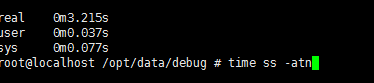
用time 统计时间 结果ss 性能还差 ?? 这是什么原因? Google了一下 好像是由于-a 解析域名吧!!
所以将 ss -atn 变为 ss -at的时候 发现 ss 的效率比netstat 高多了!!
目前关于统计内核信息传递到用户态最基本的通信方式应该是netlink了,当然还有一个connector ;
-m, --memory  //查看每个连接的buffer使用情况
              Show socket memory usage. The output format is:
              skmem:(r<rmem_alloc>,rb<rcv_buf>,t<wmem_alloc>,tb<snd_buf>,
                            f<fwd_alloc>,w<wmem_queued>,o<opt_mem>,
                            bl<back_log>,d<sock_drop>)
              <rmem_alloc>
                     the memory allocated for receiving packet
              <rcv_buf>
                     the total memory can be allocated for receiving
                     packet
              <wmem_alloc>
                     the memory used for sending packet (which has been
                     sent to layer 3)
              <snd_buf>
                     the total memory can be allocated for sending
                     packet
              <fwd_alloc>
                     the memory allocated by the socket as cache, but
                     not used for receiving/sending packet yet. If need
                     memory to send/receive packet, the memory in this
                     cache will be used before allocate additional
                     memory.
              <wmem_queued>
                     The memory allocated for sending packet (which has
                     not been sent to layer 3)
              <ropt_mem>
                     The memory used for storing socket option, e.g.,
                     the key for TCP MD5 signature
              <back_log>
                     The memory used for the sk backlog queue. On a
                     process context, if the process is receiving
                     packet, and a new packet is received, it will be
                     put into the sk backlog queue, so it can be
                     received by the process immediately
              <sock_drop>
                     the number of packets dropped before they are de-
                     multiplexed into the socket
The entire print format of ss -m is given in the source:

      printf(" skmem:(r%u,rb%u,t%u,tb%u,f%u,w%u,o%u",
               skmeminfo[SK_MEMINFO_RMEM_ALLOC],
               skmeminfo[SK_MEMINFO_RCVBUF],
               skmeminfo[SK_MEMINFO_WMEM_ALLOC],
               skmeminfo[SK_MEMINFO_SNDBUF],
               skmeminfo[SK_MEMINFO_FWD_ALLOC],
               skmeminfo[SK_MEMINFO_WMEM_QUEUED],
               skmeminfo[SK_MEMINFO_OPTMEM]);
        if (RTA_PAYLOAD(tb[attrtype]) >=
                (SK_MEMINFO_BACKLOG + 1) * sizeof(__u32))
                printf(",bl%u", skmeminfo[SK_MEMINFO_BACKLOG]);
        if (RTA_PAYLOAD(tb[attrtype]) >=
                (SK_MEMINFO_DROPS + 1) * sizeof(__u32))
                printf(",d%u", skmeminfo[SK_MEMINFO_DROPS]);
        printf(")");


net/core/sock.c line:3095
void sk_get_meminfo(const struct sock *sk, u32 *mem)
{
	memset(mem, 0, sizeof(*mem) * SK_MEMINFO_VARS);
	mem[SK_MEMINFO_RMEM_ALLOC] = sk_rmem_alloc_get(sk);
	mem[SK_MEMINFO_RCVBUF] = sk->sk_rcvbuf;
	mem[SK_MEMINFO_WMEM_ALLOC] = sk_wmem_alloc_get(sk);
	mem[SK_MEMINFO_SNDBUF] = sk->sk_sndbuf;
	mem[SK_MEMINFO_FWD_ALLOC] = sk->sk_forward_alloc;
	mem[SK_MEMINFO_WMEM_QUEUED] = sk->sk_wmem_queued;
	mem[SK_MEMINFO_OPTMEM] = atomic_read(&sk->sk_omem_alloc);
	mem[SK_MEMINFO_BACKLOG] = sk->sk_backlog.len;
	mem[SK_MEMINFO_DROPS] = atomic_read(&sk->sk_drops);
}
–memory/-m : 展示buffer窗口的大小

#ss -m | xargs -L 1 | grep "ESTAB" | awk '{ if($3>0 || $4>0) print $0 }'
tcp ESTAB 0 31 10.97.137.1:7764 10.97.137.2:41019 skmem:(r0,rb7160692,t0,tb87040,f1792,w2304,o0,bl0)
tcp ESTAB 0 193 ::ffff:10.97.137.1:sdo-tls ::ffff:10.97.137.2:55545 skmem:(r0,rb369280,t0,tb87040,f1792,w2304,o0,bl0)
tcp ESTAB 0 65 ::ffff:10.97.137.1:splitlock ::ffff:10.97.137.2:47796 skmem:(r0,rb369280,t0,tb87040,f1792,w2304,o0,bl0)
tcp ESTAB 0 80 ::ffff:10.97.137.1:informer ::ffff:10.97.137.3:49279 skmem:(r0,rb369280,t0,tb87040,f1792,w2304,o0,bl0)
tcp ESTAB 0 11 ::ffff:10.97.137.1:acp-policy ::ffff:10.97.137.2:41607 skmem:(r0,rb369280,t0,tb87040,f1792,w2304,o0,bl0)
#ss -m -n | xargs -L 1 | grep "tcp EST" | grep "t[1-9]"
tcp ESTAB 0 281 10.97.169.173:32866 10.97.170.220:3306 skmem:(r0,rb4619516,t2304,tb87552,f1792,w2304,o0,bl0)
tb指可分配的发送buffer大小,不够还可以动态调整(应用没有写死的话),w[The memory allocated for sending packet (which has not been sent to layer 3)]已经预分配好了的size,t[the memory used for sending packet (which has been sent to layer 3)] , 似乎 w总是等于大于t?
ss -s
统计所有连接的状态
nstat
nstat -z -t 1 类似 netstat -s (ss –info 展示rto、拥塞算法等更详细信息; netstat -ant -o 展示keepalive是否)
ss分析重传的包数量
通过抓取ss命令,可以分析出来重传的包数量,然后将重传的流的数量和重传的包的数量按照对端IP:port的维度分段聚合,参考命令:
ss -itn |grep -v "Address:Port" | xargs -L 1 | grep retrans | awk '{gsub("retrans:.*/", "",$21); print $5, $21}' | awk '{arr[$1]+=$2} END {for (i in arr) {print i,arr[i]}}' | sort -rnk 2 ss 查看 timer 状态
ss -atonp
按连接状态过滤
Display All Established HTTP Connections
ss -o state established '( dport = :http or sport = :http )'List all the TCP sockets in state -FIN-WAIT-1 for our httpd to network 202.54.1/24 and look at their timers:
ss -o state fin-wait-1 ‘( sport = :http or sport = :https )’ dst 202.54.1/24
Filter Sockets Using TCP States
ss -4 state FILTER-NAME-HERE
ss 查看拥塞窗口、RTO
//rto的定义,不让修改,每个ip的rt都不一样,必须通过rtt计算所得, HZ 一般是1秒
#define TCP_RTO_MAX ((unsigned)(120*HZ))
#define TCP_RTO_MIN ((unsigned)(HZ/5)) //在rt很小的环境中计算下来RTO基本等于TCP_RTO_MIN
下面看到的rto和rtt单位都是毫秒,一般rto最小为200ms、最大为120秒
ss -itn |egrep "cwnd|rto"
	 cubic wscale:7,7 rto:214 rtt:13.993/19.952 ato:40 mss:65483 rcvmss:735 advmss:65483 cwnd:10 ssthresh:7 bytes_acked:8649 bytes_received:8972 segs_out:53 segs_in:55 send 374.4Mbps lastsnd:14060 lastrcv:14122 lastack:14020 pacing_rate 748.7Mbps rcv_rtt:9887.75 rcv_space:43690
	 cubic wscale:7,7 rto:227 rtt:26.072/5.278 ato:40 mss:1412 rcvmss:1404 advmss:1460 cwnd:7 ssthresh:7 bytes_acked:1294388 bytes_received:4895990 segs_out:2301 segs_in:4782 send 3.0Mbps lastsnd:4439 lastrcv:4399 lastack:4399 pacing_rate 6.1Mbps retrans:0/4 rcv_rtt:60399 rcv_space:54490

 浙公网安备 33010602011771号