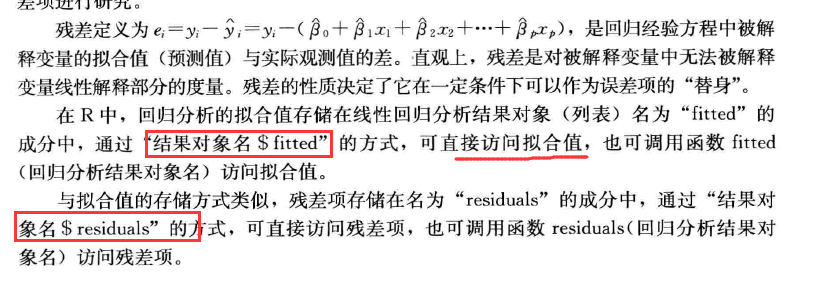
回归分析
1.概述
- 选择回归模型和回归方程
- 一般线性模型被解释变量是一个服从正态分布的连续型数值变量。若研究它如何受多个数值型解释变量的影响,则选择的回归模型是一元或多元回归模型;若研究它如何受到离散型数值变量以及分类型变量的影响,则选择带有虚拟变量的回归模型
- 广义线性模型的被解释变量是0-1变量。若研究它如何受多个解释变量的影响,则建立logistic模型。若被解释变量是计数变量:最近一个月内的购物次数...,采用泊松分布
- 回归方程的参数估计与检验
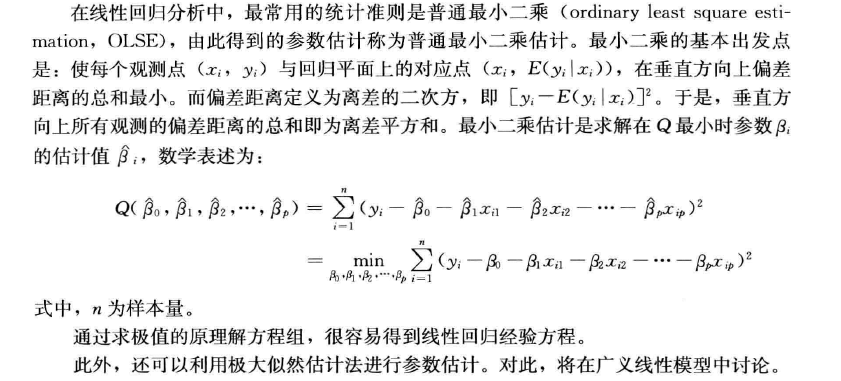
- 最小二/极大似然
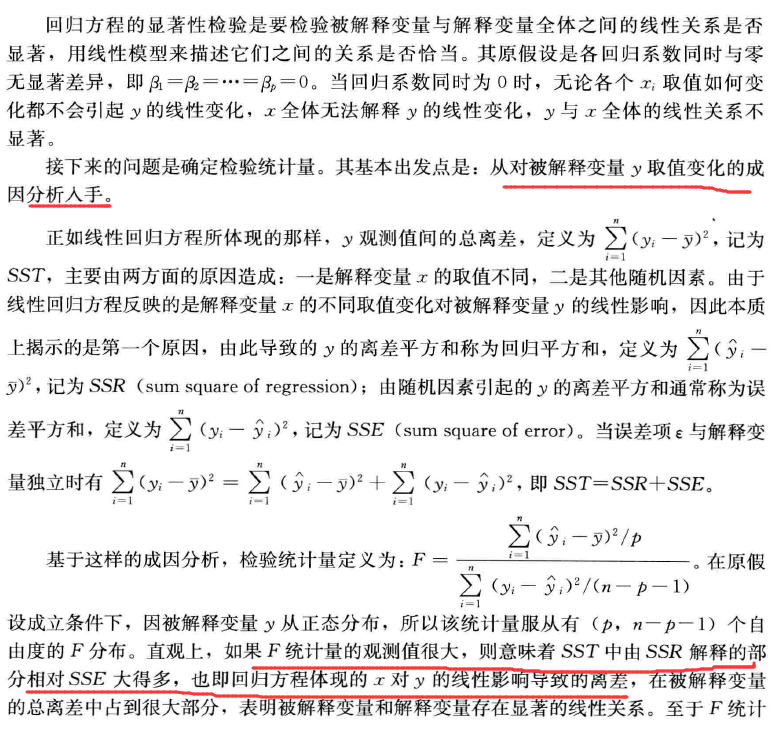
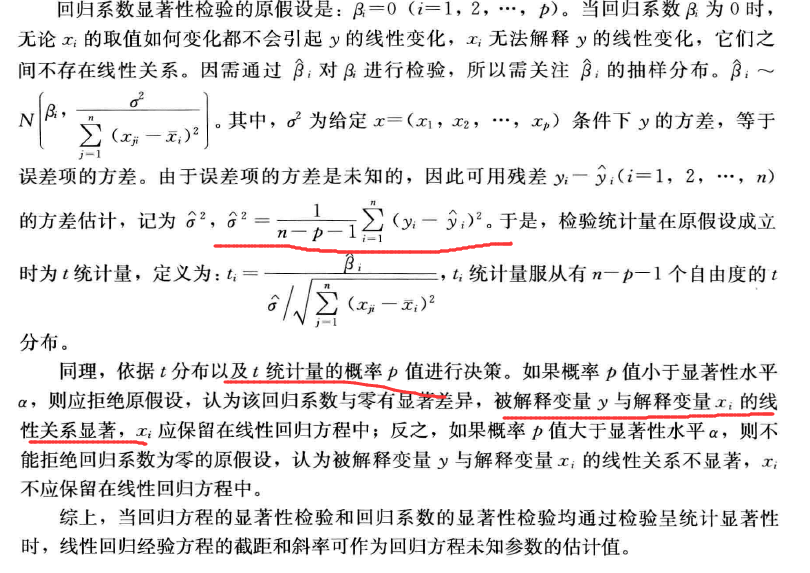
- 回归方程的显著性、回归系数的显著性
- 回归诊断
- 回归模型对数据是有假设的,若无法满足这些假设,则方程可能因为存在很大偏差而没有意义
- 回归方程可能受到异常点的影响。是否需要在排除其影响下重新建立方程
- 多重共线性的诊断
- 模型验证
- 回归方程的主要目的是预测,预测的精度或误差是模型验证的重要内容。
2.建立回归模型
2.1模型
- 由解释变量引起的Y的线性变化
- 由误差项引起的
2.2假设
alpson服从正态分布

2.3参数估计
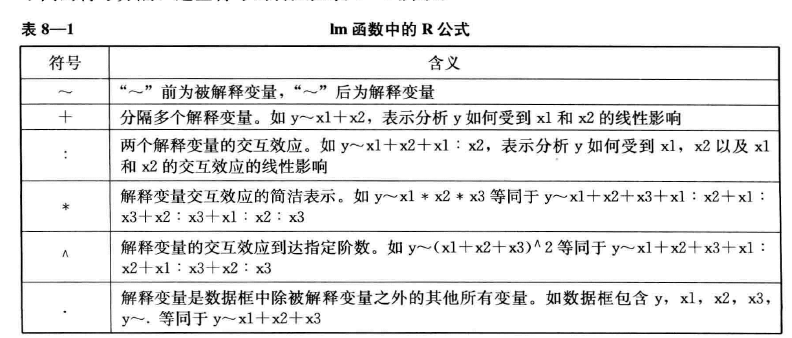
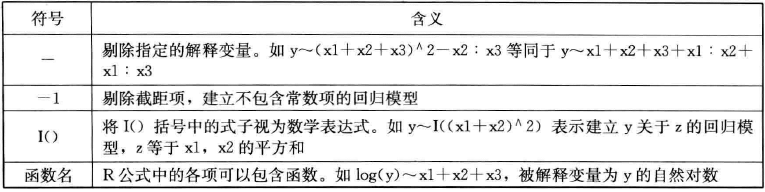
2.4 R程序
lm(R公式,data=数据框名)
coefficients(回归分析结果对象名)

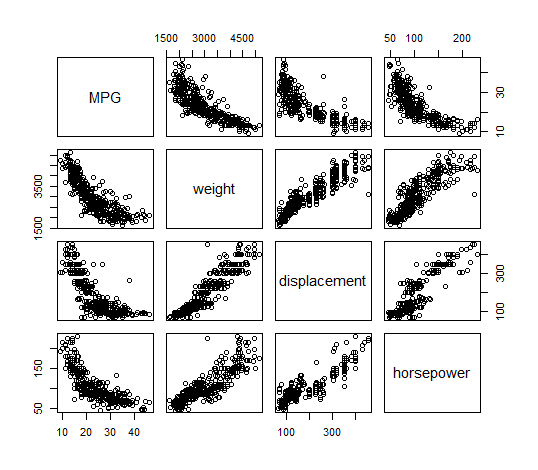
1.画图
CarData<-read.table(file="CarData.txt",header=TRUE)
CarData$ModelYear<-as.factor(CarData$ModelYear)
#查看相关关系
pairs(~MPG+weight+displacement+horsepower,data=CarData)
2.建立模型
##########建立线性回归经验方程
Fit<-lm(MPG~weight+displacement+horsepower,data=CarData)

#############浏览回归分析结果
>coefficients(Fit)

 (Intercept)       weight displacement   horsepower
44.855935695 -0.005351593 -0.005768819 -0.041674144
方程显著;回归系数:displacement不显著
2.4.回归诊断
#方程显著性
>summary(Fit)

Call:
lm(formula = MPG ~ weight + displacement + horsepower, data = CarData)

Residuals:
     Min       1Q   Median       3Q      Max
-11.3347  -2.8028  -0.3402   2.2037  16.2409

Coefficients:
               Estimate Std. Error t value Pr(>|t|)
(Intercept)  44.8559357  1.1959200  37.507  < 2e-16 ***
weight       -0.0053516  0.0007124  -7.513 4.04e-13 ***
displacement -0.0057688  0.0065819  -0.876  0.38132
horsepower   -0.0416741  0.0128139  -3.252  0.00125 **
---
Signif. codes:  0 ‘***’ 0.001 ‘**’ 0.01 ‘*’ 0.05 ‘.’ 0.1 ‘ ’ 1

Residual standard error: 4.241 on 388 degrees of freedom
  (6 observations deleted due to missingness)
Multiple R-squared:  0.707,	Adjusted R-squared:  0.7047
F-statistic:   312 on 3 and 388 DF,  p-value: < 2.2e-16


>confint(Fit)

                   2.5 %       97.5 %
(Intercept)  42.50464109 47.207230298
weight       -0.00675215 -0.003951036
displacement -0.01870945  0.007171815
horsepower   -0.06686744 -0.016480849
- F:方程显著性
- t:系数显著性
因为方程中包含系数不显著的解释变量,所以模型需要改进
Fit<-lm(MPG~weight+horsepower,data=CarData)
summary(Fit)

Call:
lm(formula = MPG ~ weight + horsepower, data = CarData)

Residuals:
     Min       1Q   Median       3Q      Max
-11.0762  -2.7340  -0.3312   2.1752  16.2601

Coefficients:
              Estimate Std. Error t value Pr(>|t|)
(Intercept) 45.6402108  0.7931958  57.540  < 2e-16 ***
weight      -0.0057942  0.0005023 -11.535  < 2e-16 ***
horsepower  -0.0473029  0.0110851  -4.267 2.49e-05 ***
---
Signif. codes:  0 ‘***’ 0.001 ‘**’ 0.01 ‘*’ 0.05 ‘.’ 0.1 ‘ ’ 1

Residual standard error: 4.24 on 389 degrees of freedom
  (6 observations deleted due to missingness)
Multiple R-squared:  0.7064,	Adjusted R-squared:  0.7049
F-statistic: 467.9 on 2 and 389 DF,  p-value: < 2.2e-16
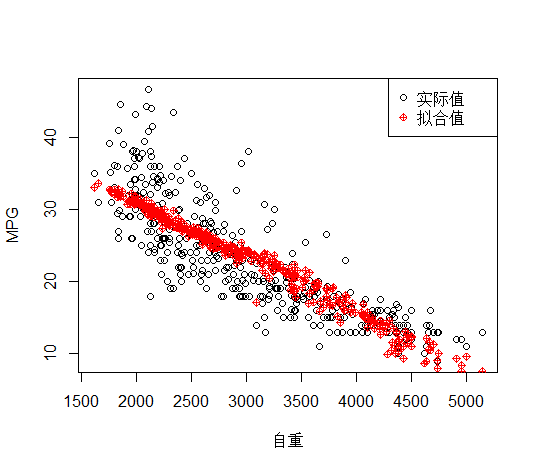
2.5预测
FitMPG<-predict(Fit,CarData,type="response")    ##预测
plot(CarData$weight,CarData$MPG,pch=1,xlab="自重",ylab="MPG")
points(CarData$weight,FitMPG,pch=10,col=2)
legend("topright",c("实际值","拟合值"),pch=c(1,10),col=c(1,2))
3.回归诊断
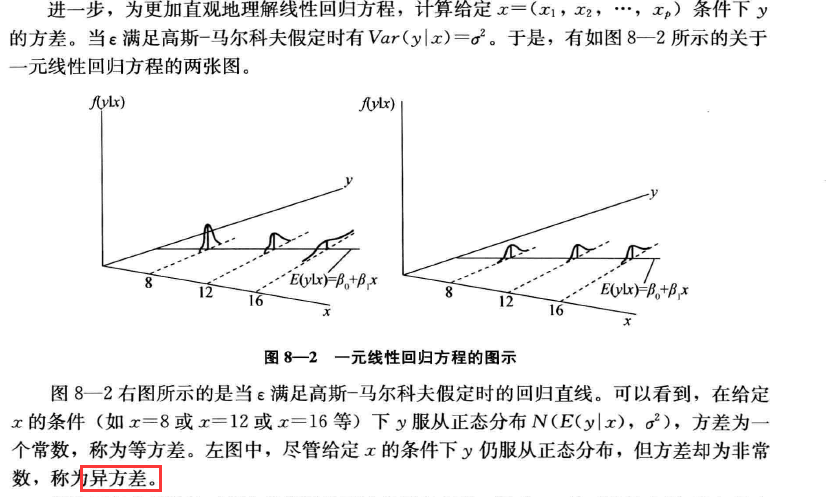
3.1误差项是否符合高斯-马尔科夫定理
3.1.1残差与误差
模型中的误差项是那些与解释变量无关的因素导致的偏差,误差无法衡量,所以用残差来进行研究
3.1.2高斯-马尔科夫定理
- 独立性:第i个观测的误差与第j个误差不相关,在截面数据中容易满足
- 正态性:第二与第三个可从残差图形中直观判断。
- 等方差性
1.独立性检验
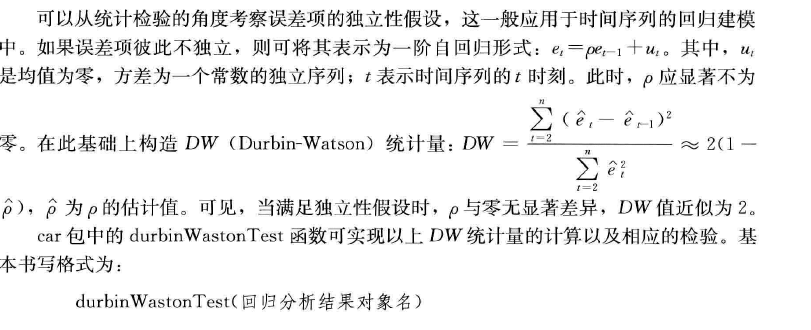
library("car")
>durbinWatsonTest(Fit)    ##独立性检验

lag Autocorrelation D-W Statistic p-value
   1       0.5575821      0.880059       0
 Alternative hypothesis: rho != 0

2.正态性与等差性
############拟合值与残差值
fitted(Fit)
residuals(Fit)
#######绘制残差图
par(mfrow=c(2,2))
plot(Fit)
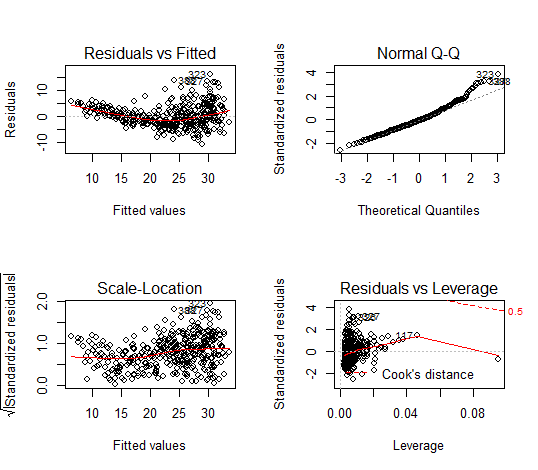
- 考察的是 正态分布假定
- 考察队是残差项等方差假定。本例中,残差随着拟合值的增大而有扩散的趋势,不满足等方差假定。
解决异方差办法:
- 采用加权最小二乘法。普通最小二乘法的离差平方和中个观测变量对平方和的贡献相等,而方差偏大的贡献更大,所以回归线偏向方差大的观测。加权最小二乘的权值估计很重要,若能找到异方差与解释变量的函数形式,就能方便的估计各个观测的权值,否则应采用异方差-稳健t统计量进行显著性检验。

2.对被解释变量做BOX-COX变换后在建立模型,最常见的是取log。
##########重新建立对数-水平的二元回归经验方程
Fit<-lm(log(MPG)~weight+horsepower,data=CarData)
summary(Fit)
par(mfrow=c(2,2))
plot(Fit)
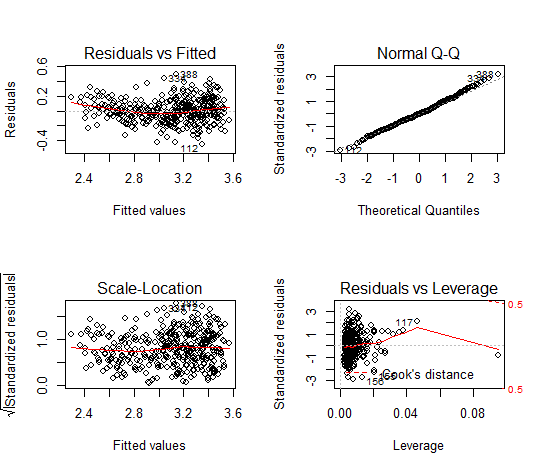
- 对数-水平模型,x变动一单位引起的y变化的百分比semi-elasticity
- 图中残差的到了很好的改善,基本满足了正态分布与等差性要求
- 进一步思考:如果所建立的模型没有一楼对被解释变量有重要影响的解释变量,那么残差不应与拟合值有关系
不满足正态性的处理
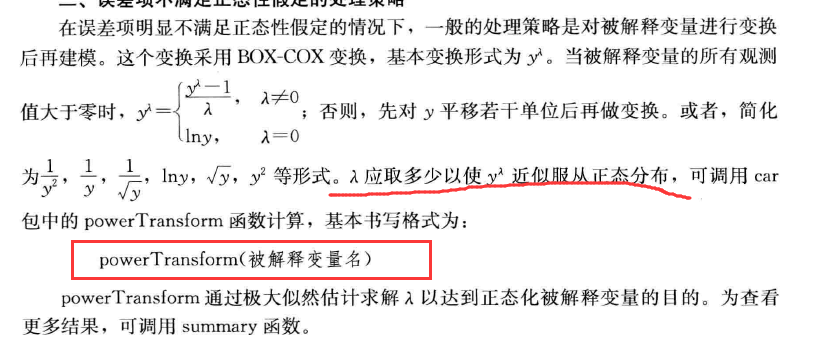
>summary(powerTransform(CarData$MPG)) #非正态性处理
bcPower Transformation to Normality
Est Power Rounded Pwr Wald Lwr bnd Wald Upr Bnd
CarData$MPG 0.1974 0 -0.0907 0.4854
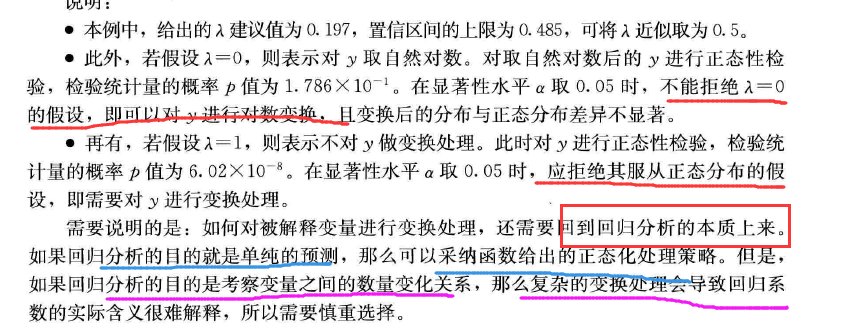
Likelihood ratio tests about transformation parameters
LRT df pval
LR test, lambda = (0) 1.809026 1 1.786251e-01
LR test, lambda = (1) 29.356835 1 6.020380e-08
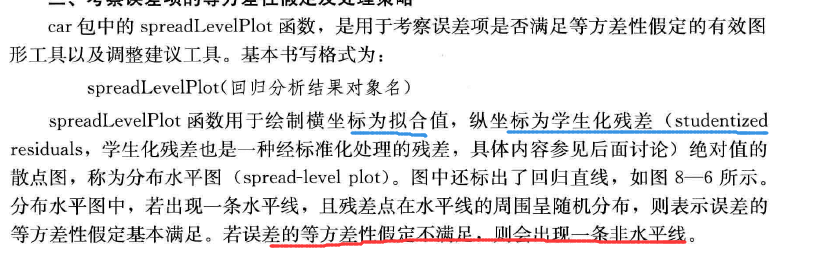
等方差性的处理
>spreadLevelPlot(Fit)   #等方差性假定图形
Suggested power transformation:  0.4920781

>ncvTest(Fit)   #等方差性假定检验
Non-constant Variance Score Test
Variance formula: ~ fitted.values
Chisquare = 3.720084    Df = 1     p = 0.05376168

>crPlots(Fit)   ####被解释变量和解释变量的线性相关性判断
解释变量与被解释变量的线性关系

crPlots(Fit)
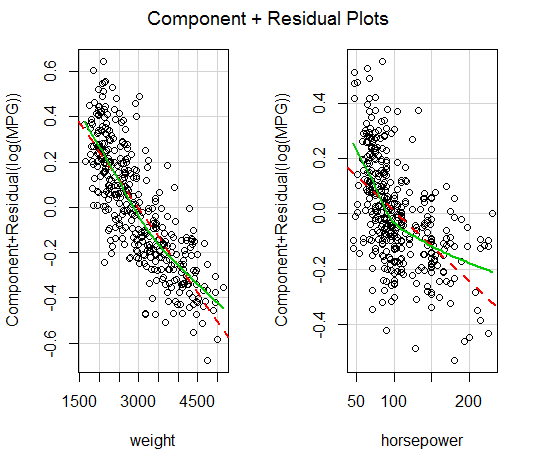
线性关系较明显,基本满足高斯条件。
3.2诊断数据中的异常点
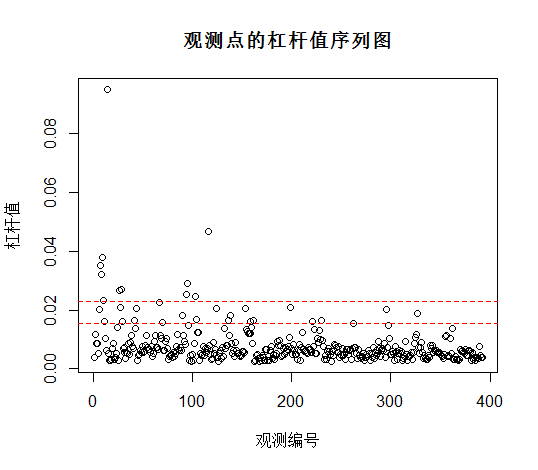
3.2.1高杠杆值点
在解释变量方向上取异常值,在被解释变量上正常的点。
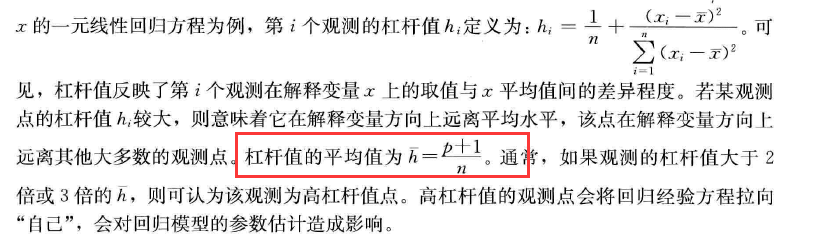
hatvalues(回归分析结果对象名)
LeveragePlot<-function(fit){
 Np<-length(coefficients(fit))-1
 N<-length(fitted(fit))
 plot(hatvalues(fit),main="观测点的杠杆值序列图",ylab="杠杆值",xlab="观测编号")
 abline(2*(Np+1)/N,0,col="red",lty=2)
 abline(3*(Np+1)/N,0,col="red",lty=2)
 identify(1:N,hatvalues(fit),names(hatvalues(fit)))
 }
LeveragePlot(Fit)
3.2.2离群点
rstudent()#学生化残差
outlierTest()#离群点
###############探测离群点
library("car")
Fit<-lm(log(MPG)~weight+horsepower,data=CarData)
rstudent(Fit)
outlierTest(Fit)
Fit<-lm(log(MPG)~weight+horsepower,data=CarData[-388,])
outlierTest(Fit)

> outlierTest(Fit)

No Studentized residuals with Bonferonni p < 0.05
Largest |rstudent|:
    rstudent unadjusted p-value Bonferonni p
388 3.224743          0.0013677      0.53613


> Fit<-lm(log(MPG)~weight+horsepower,data=CarData[-388,])
> outlierTest(Fit)

No Studentized residuals with Bonferonni p < 0.05
Largest |rstudent|:
     rstudent unadjusted p-value Bonferonni p
112 -2.999241          0.0028815           NA
第一个测出388是离群点,p-value=0.54,不能拒绝原假设,所以Fit<-lm(log(MPG)~weight+horsepower,data=CarData[-388,])
3.2.3强影响点
包含或者剔除改点会使得回归方程的截距或者斜率有较大变化。
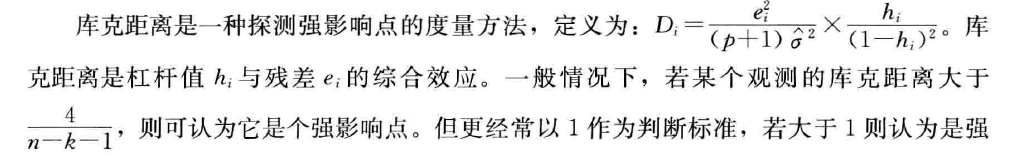
cooks.distance()
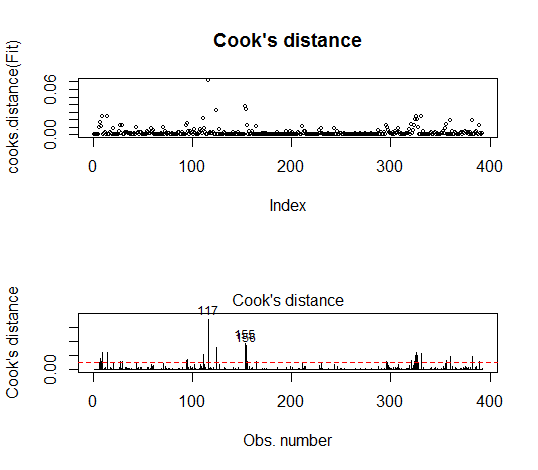
利用图形展示各观测点的库克距离
#######################探测强影响点
Fit<-lm(log(MPG)~weight+horsepower,data=CarData)
par(mfrow=c(2,1))
plot(cooks.distance(Fit),main="Cook's distance",cex=0.5)      #获得Cook距离
#用identify函数做互动可以获得高库克距离的观测点

Np<-length(coefficients(Fit))-1#系数长度
N<-length(fitted(Fit))#样本量
CutLevel<-4/(N-Np-1)#公式,把判断标准画出来

plot(Fit,which=4)#自动绘制6幅图,第四幅更显著,就只显示第四幅
abline(CutLevel,0,lty=2,col="red")
 、
、
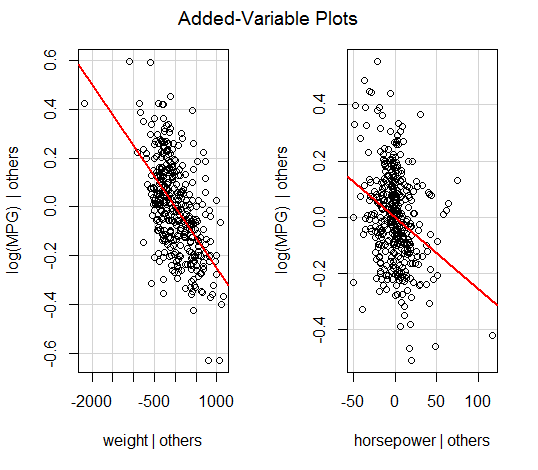
分别查看weight与horsepower对斜率的影响
library("car")
avPlots(Fit,ask=FALSE,onepage=TRUE,id.method="identify")
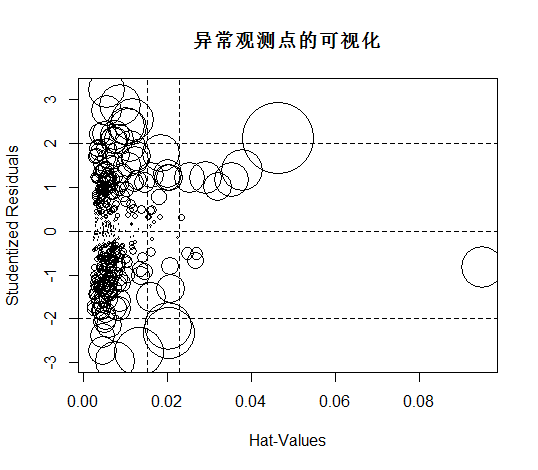
##############异常观测点的综合展示
Fit<-lm(log(MPG)~weight+horsepower,data=CarData)
influencePlot(Fit,id.method="identify",main="异常观测点的可视化")
3.3多重共线性的诊断
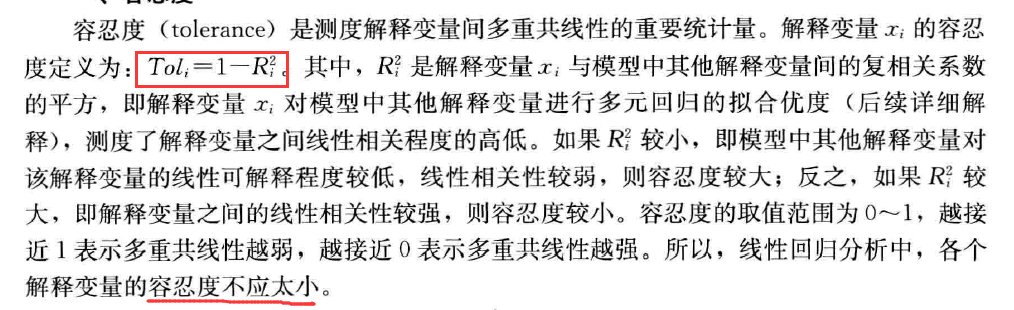
1.容忍度
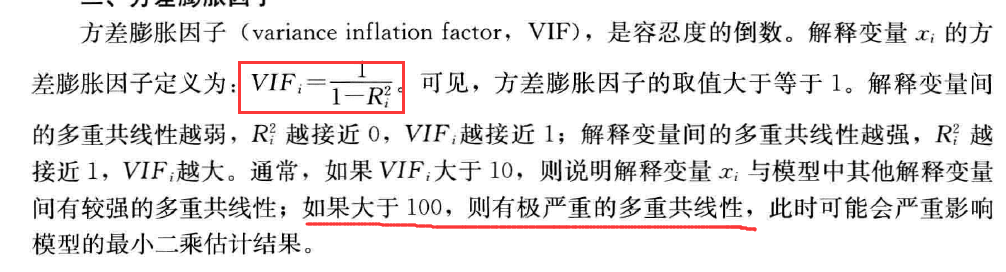
2.方差膨胀因子
> library("car")
> vif(Fit)
    weight horsepower
  3.959228   3.959228
有一定的共线性,但是不强
4.回归建模策略
1.拟合优度最高
r-square越接近1,拟合优度越高
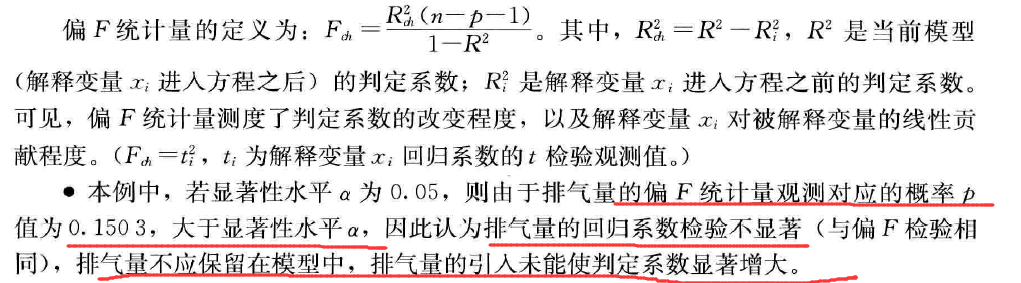
Fit1<-lm(log(MPG)~weight+horsepower,data=CarData)
Fit2<-lm(log(MPG)~weight+horsepower+displacement,data=CarData)
summary(Fit1)
summary(Fit2)
anova(Fit1,Fit2)

Analysis of Variance Table

Model 1: log(MPG) ~ weight + horsepower
Model 2: log(MPG) ~ weight + horsepower + displacement
  Res.Df    RSS Df Sum of Sq      F Pr(>F)
1    389 9.5871
2    388 9.5360  1  0.051059 2.0775 0.1503
增加变量会使误差平方和减小:9.58-9.53
这里的F指的是偏F统计量
2.带惩罚的拟合优度最高点模型。
AIC&BIC
AIC=-2ln(模型中极大似然函数值)+2(模型中未知参数个数)
SBC=-2ln(模型中极大似然函数值)+ln(n)(模型中未知参数个数)
越小越好
> Fit1<-lm(log(MPG)~weight+horsepower,data=CarData)
> Fit2<-lm(log(MPG)~weight+horsepower+displacement,data=CarData)
> AIC(Fit1,Fit2)
     df       AIC
Fit1  4 -334.2030
Fit2  5 -334.2963
> BIC(Fit1,Fit2)
     df       BIC
Fit1  4 -318.3179
Fit2  5 -314.4399
选第一个模型:BIC更小
3.解释变量的筛选

- 向前筛选
- 向后筛选
- 逐步筛选
#######不同解释变量筛选策略下的AIC
Fit<-lm(log(MPG)~weight+horsepower+displacement+cylinders+acceleration,data=CarData)
library("MASS")
stepAIC(Fit,direction="backward")


Start:  AIC=-1449.07
log(MPG) ~ weight + horsepower + displacement + cylinders + acceleration

               Df Sum of Sq     RSS     AIC
- displacement  1   0.00007  9.4316 -1451.1#剔除会让AIC减少的最多
- acceleration  1   0.03725  9.4687 -1449.5
<none>                       9.4315 -1449.1
- cylinders     1   0.07211  9.5036 -1448.1
- horsepower    1   0.49772  9.9292 -1430.9
- weight        1   1.09267 10.5242 -1408.1

Step:  AIC=-1451.06
log(MPG) ~ weight + horsepower + cylinders + acceleration

               Df Sum of Sq     RSS     AIC
- acceleration  1   0.03733  9.4689 -1451.5
<none>                       9.4316 -1451.1
- cylinders     1   0.13744  9.5690 -1447.4
- horsepower    1   0.53766  9.9692 -1431.3
- weight        1   1.35833 10.7899 -1400.3

Step:  AIC=-1451.51
log(MPG) ~ weight + horsepower + cylinders

             Df Sum of Sq     RSS     AIC
<none>                     9.4689 -1451.5
- cylinders   1   0.11820  9.5871 -1448.7
- horsepower  1   0.68621 10.1551 -1426.1
- weight      1   2.06375 11.5326 -1376.2

Call:
lm(formula = log(MPG) ~ weight + horsepower + cylinders, data = CarData)

Coefficients:
(Intercept)       weight   horsepower    cylinders
  4.1169705   -0.0002178   -0.0022721   -0.0242519
全子集回归模型


 浙公网安备 33010602011771号