R的数据管理
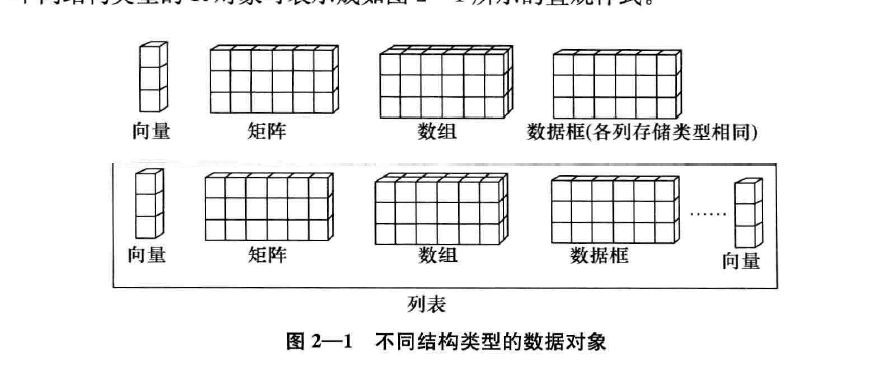
1.数据对象
1.1结构
- vector。具有相同类型的数据的集合,默认为列向量。Factor也是特殊向量。
- matrix。组织多个具有相同类型的向量。列为变量(实例),行为观测(因子)
- array数组。多张二维表的集合
- dataframe.与矩阵类似,但是储存类型不同的变量。
- list列表。多个向量、矩阵、数组、数据库的集合。用于将相关统计分析结果“打包”
1.2向量
#查看对象结构
str()
#管理对象
ls()
rm()
remove()
向量的创建
X<-c(1,1,1)
length(X)
Y<-c(2,2,2)
temp<-c(14.7,18.5,25.9)
RH<-c(66,73,41)
wind<-c(2.7,8.5,3.6)
rain<-c(0,0,0)
area<-rain
month<-c("aug","aug","aug")
day<-rep("fri",each=3)
rank<-seq(from=1,to=3,by=1)
str(month)
str(rank)
ls()
rep(begin:end,each=repeat times)#每个值重复多少次
rep(begin:end,times=repeat times)#向量重复多少次
seq(from=,to=,by=)

seq(from=,to=,length=)

vector(length=)#包含多少元素
访问向量
1.访问指定位置的元素
向量名[位置变量]
向量名[位置变量1:位置变量2]
向量名[c(位置变量列表)]
> a<-vector(length=10)
> a
 [1] FALSE FALSE FALSE FALSE FALSE FALSE FALSE FALSE FALSE FALSE
> a[1]<-1
> a[2:4]<-c(2,3,4)
> a
 [1] 1 2 3 4 0 0 0 0 0 0
> b<-seq(from=5,to=9,by=1)
> a[c(5:9,10)]<-c(b,10)#访问5~9和第10个向量,并赋值5~10
> a
 [1]  1  2  3  4  5  6  7  8  9 10
2.利用位置向量访问指定位置的元素
向量名[位置向量名]
> b<-(2:4)
> a[b]
[1] 2 3 4
> b<-c(TRUE,FALSE,FALSE,TRUE,FALSE,FALSE,FALSE,FALSE,FALSE,FALSE)
> a[b]
[1] 1 4
3.访问指定位置外的元素
向量名[-位置变量]
向量名[-(位置变量1:位置变量2)]
向量名[-c(位置变量列表)]
向量名[-位置变量名]
> a[-(2:4)]
[1]  1  5  6  7  8  9 10
> a[-c(5:9,10)]
[1] 1 2 3 4
> b<-(2:4)
> a[-b]
[1]  1  5  6  7  8  9 10
1.3矩阵
合并多个向量
#合并列向量
cbind(向量名列表)
#显示列数
dim(矩阵名)
#命名
colnames()
colnames(矩阵名[,列位置常量1:2])
rownames()
rownames(矩阵名[行位置常量1:2,])
> ForeData<-cbind(X,Y,temp,RH,wind,rain,area,rank)
> dim(ForeData)
[1] 3 8
> ForeData
     X Y temp RH wind rain area rank
[1,] 1 2 14.7 66  2.7    0    0    1
[2,] 1 2 18.5 73  8.5    0    0    2
[3,] 1 2 25.9 41  3.6    0    0    3
> str(ForeData)
 num [1:3, 1:8] 1 1 1 2 2 2 14.7 18.5 25.9 66 ...
 - attr(*, "dimnames")=List of 2
  ..$ : NULL
  ..$ : chr [1:8] "X" "Y" "temp" "RH" ...
> colnames(ForeData)
[1] "X"    "Y"    "temp" "RH"   "wind" "rain" "area" "rank"
> colnames(ForeData[,3:5])
[1] "temp" "RH"   "wind"
> rownames(ForeData)<-c("1","2","3")
> rownames(ForeData[c(1,3),])
[1] "1" "3"
> is.matrix(ForeData)
[1] TRUE
a<-(1:9)
b<-(1:3)
c<-(1:2)
cbind(a,b)
cbind(a,b,c)
rbind(a,b)#行合并
rm(a,b,c)
2.如果matrix中的数据已经存在于某个向量中,则可以将此向量按特定方式派生为矩阵
matrix(data = NA, nrow = 1, ncol = 1, byrow = FALSE,
       dimnames = list(rownames,colnames))
> a<-(1:30)
> dim1<-c("R1","R2","R3","R4","R5")
> dim2<-c("C1","C2","C3","C4","C5","C6")
> a<-matrix(a,nrow=5,ncol=6,byrow=FALSE,dimnames=list(dim1,dim2))
> a
   C1 C2 C3 C4 C5 C6
R1  1  6 11 16 21 26
R2  2  7 12 17 22 27
R3  3  8 13 18 23 28
R4  4  9 14 19 24 29
R5  5 10 15 20 25 30
访问矩阵中的元素
1.指定位置上的元素
矩阵名[行位置常量,列位置常量]
矩阵名{行位置常量1:行位置常量2,列位置常量1:列位置常量2】
矩阵名[c(行位置常量列表),c(列位置常量列表)]
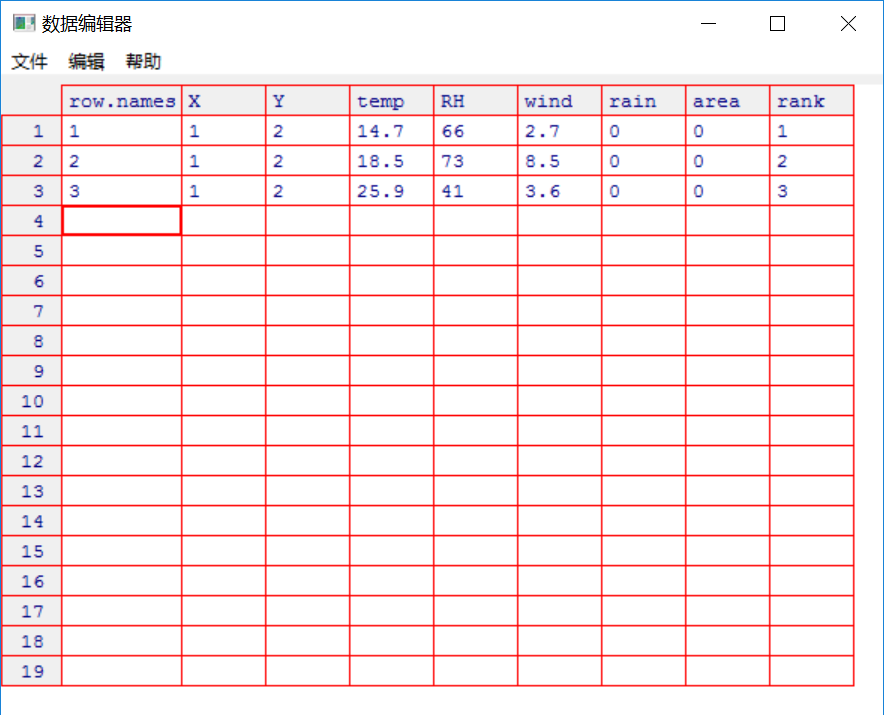
> ForeData
  X Y temp RH wind rain area rank
1 1 2 14.7 66  2.7    0    0    1
2 1 2 18.5 73  8.5    0    0    2
3 1 2 25.9 41  3.6    0    0    3
> ForeData[2,3]
[1] 18.5
> ForeData[1:2,1:3]
  X Y temp
1 1 2 14.7
2 1 2 18.5
> a<-(1:2)
> ForeData[a,c(1,3)]
  X temp
1 1 14.7
2 1 18.5
> ForeData[c(1,3),]
  X Y temp RH wind rain area rank
1 1 2 14.7 66  2.7    0    0    1
3 1 2 25.9 41  3.6    0    0    3
2.利用编辑窗口访问元素
fix(ForeData)
矩阵计算
1.合并
(m1<-matrix(1,nrow=2,ncol=2))
(m2<-matrix(2,nrow=2,ncol=2))
(mm1<-cbind(m1,m2))
(mm2<-rbind(m1,m2))
2.乘法
%*%
(mm3<-mm1%*%mm2)
(mm3<-mm2%*%mm1)
3.创建对角矩阵
> diag(8)  #创建8乘8的单位阵
     [,1] [,2] [,3] [,4] [,5] [,6] [,7] [,8]
[1,]    1    0    0    0    0    0    0    0
[2,]    0    1    0    0    0    0    0    0
[3,]    0    0    1    0    0    0    0    0
[4,]    0    0    0    1    0    0    0    0
[5,]    0    0    0    0    1    0    0    0
[6,]    0    0    0    0    0    1    0    0
[7,]    0    0    0    0    0    0    1    0
[8,]    0    0    0    0    0    0    0    1
> diag(c(1,2,3,4))
     [,1] [,2] [,3] [,4]
[1,]    1    0    0    0
[2,]    0    2    0    0
[3,]    0    0    3    0
[4,]    0    0    0    4
> diag(c(1,2,3,4),nrow=3,ncol=4)
     [,1] [,2] [,3] [,4]
[1,]    1    0    0    0
[2,]    0    2    0    0
[3,]    0    0    3    0
4.转置&逆
t()
solve()
eigen()#特征向量与特征值
1.3数组
array(data = NA, dim = length(data), dimnames = list(维名称列表))
a<-(1:60)
dim1<-c("R1","R2","R3","R4")
dim2<-c("C1","C2","C3","C4","C5")
dim3<-c("T1","T2","T3")
a<-array(a,c(4,5,3),dimnames=list(dim1,dim2,dim3))
>a
, , T1

   C1 C2 C3 C4 C5
R1  1  5  9 13 17
R2  2  6 10 14 18
R3  3  7 11 15 19
R4  4  8 12 16 20

, , T2

   C1 C2 C3 C4 C5
R1 21 25 29 33 37
R2 22 26 30 34 38
R3 23 27 31 35 39
R4 24 28 32 36 40

, , T3

   C1 C2 C3 C4 C5
R1 41 45 49 53 57
R2 42 46 50 54 58
R3 43 47 51 55 59
R4 44 48 52 56 60

> a[1:3,c(1,3),]#所有表格1~3行,1、3列的元素
, , T1

   C1 C3
R1  1  9
R2  2 10
R3  3 11

, , T2

   C1 C3
R1 21 29
R2 22 30
R3 23 31

, , T3

   C1 C3
R1 41 49
R2 42 50
R3 43 51
1.4dataframe
创建
data.frame(域名1=向量名1,域名2=向量名2,...)
names(数据框名)
> ForeDataFrm<-data.frame(FX=X,FY=Y,Fmonth=month,Fday=day,Ftemp=temp,FRH=RH,Fwind=wind,Frain=rain,Farea=area)
> ForeDataFrm
  FX FY Fmonth Fday Ftemp FRH Fwind Frain Farea
1  1  2    aug  fri  14.7  66   2.7     0     0
2  1  2    aug  fri  18.5  73   8.5     0     0
3  1  2    aug  fri  25.9  41   3.6     0     0
> names(ForeDataFrm)
[1] "FX"     "FY"     "Fmonth" "Fday"   "Ftemp"  "FRH"    "Fwind"
[8] "Frain"  "Farea"

> str(ForeDataFrm)
'data.frame':	3 obs. of  9 variables:
 $ FX    : num  1 1 1
 $ FY    : num  2 2 2
 $ Fmonth: Factor w/ 1 level "aug": 1 1 1
 $ Fday  : Factor w/ 1 level "fri": 1 1 1
 $ Ftemp : num  14.7 18.5 25.9
 $ FRH   : num  66 73 41
 $ Fwind : num  2.7 8.5 3.6
 $ Frain : num  0 0 0
 $ Farea : num  0 0 0
若创建数据框时尚未有数据与之对应:
> a<-data.frame(x1=numeric(0),x2=character(0),x3=logical(0))
> str(a)
'data.frame':	0 obs. of  3 variables:
 $ x1: num
 $ x2: Factor w/ 0 levels:
 $ x3: logi
> fix(a)
访问
1.数据框名$域名
2.数据框名[["域名"]]
3.数据框名[[域编号]]
4.
attach(数据框名)
访问域名函数1
访问域名函数2
...
detach(数据框名)

with(数据框名,{域访问函数1,...})#不可以修改域中的数据

数据框名<-within(数据框名,{域访问函数1,...})
> ForeDataFrm
  FX FY Fmonth Fday Ftemp FRH Fwind Frain Farea
1  1  2    aug  fri  14.7  66   2.7     0     0
2  1  2    aug  fri  18.5  73   8.5     0     0
3  1  2    aug  fri  25.9  41   3.6     0     0
> ForeDataFrm$Fwind
[1] 2.7 8.5 3.6
> ForeDataFrm[["Ftemp"]]
[1] 14.7 18.5 25.9
> ForeDataFrm[[5]]
[1] 14.7 18.5 25.9
> ForeDataFrm$Ftemp<-ForeDataFrm$Ftemp*1.8+32#对指定域名进行操作
> attach(ForeDataFrm)
> Ftemp
[1] 58.46 65.30 78.62
> Fwind
[1] 2.7 8.5 3.6
> detach(ForeDataFrm)
> Ftemp #detach以后就不能操作了
Error: object 'Ftemp' not found
> with(ForeDataFrm,{
+ print(Ftemp)
+ Ftemp<-(Ftemp-32)/1.8
+ print(Ftemp)
+ print(Fwind)
+ })
[1] 58.46 65.30 78.62
[1] 14.7 18.5 25.9
[1] 2.7 8.5 3.6
1.5list
list(成分名1=对象名1,....)
创建一个名为d的列表,成分名为L1,L2,L3,依次对应a,b,c三个对象
a<-c(1,2,3)
b<-matrix(nrow=5,ncol=2)
b[,1]=seq(from=1,to=10,by=2)
b[,2]=seq(from=10,to=1,by=-2)
c<-array(1:60,c(4,5,3))
d<-list(L1=a,L2=b,L3=c)
names(d)
str(d)
is.list(d)
d$L1
d[["L2"]]
d[[2]]
> str(d)
List of 3
$ L1: num [1:3] 1 2 3
$ L2: num [1:5, 1:2] 1 3 5 7 9 10 8 6 4 2
$ L3: int [1:4, 1:5, 1:3] 1 2 3 4 5 6 7 8 9 10 ...
> d$L1
[1] 1 2 3
> d[["L2"]]
     [,1] [,2]
[1,]    1   10
[2,]    3    8
[3,]    5    6
[4,]    7    4
[5,]    9    2
> d[[2]]
     [,1] [,2]
[1,]    1   10
[2,]    3    8
[3,]    5    6
[4,]    7    4
[5,]    9    2
1.6数据对象的相互转化
1.不同储存类型
typeof()
as.储存类型(数据对象名)
#numeric,integer,double,charactor,logical
2.不同结构类型之间的转化
> (a<-c(1:10))
 [1]  1  2  3  4  5  6  7  8  9 10
> (b<-matrix(a,nrow=5,ncol=2,byrow=TRUE))
     [,1] [,2]
[1,]    1    2
[2,]    3    4
[3,]    5    6
[4,]    7    8
[5,]    9   10
> (a<-as.matrix(a))
      [,1]
 [1,]    1
 [2,]    2
 [3,]    3
 [4,]    4
 [5,]    5
 [6,]    6
 [7,]    7
 [8,]    8
 [9,]    9
[10,]   10
> is.matrix(a)
[1] TRUE
> (b<-as.vector(b))
 [1]  1  3  5  7  9  2  4  6  8 10
> is.vector(b)
[1] TRUE
注意矩阵转成向量是从左到右的顺序
as.matrix()
as.vector()
3.向量-因子
as.factor()
factor(向量名,order=TURE/FALSE,level=c(类别值列表))
> (a<-c("Poor","Improved","Excellent","Poor"))
[1] "Poor"      "Improved"  "Excellent" "Poor"
> (b<-factor(a,order=FALSE,levels=c("Poor","Improved","Excellent")))
[1] Poor      Improved  Excellent Poor
Levels: Poor Improved Excellent
> (b<-factor(a,order=TRUE,levels=c("Poor","Improved","Excellent")))
[1] Poor      Improved  Excellent Poor
Levels: Poor < Improved < Excellent
因子-向量:R不支持对因子直接添加水平值,所以要先将因子转为向量,并添加相应类别的元素,再将向量转为因子
as.vector(因子名)
#######利用factor函数重新设置类别值
> (a<-c("Poor","Improved","Excellent","Poor"))
[1] "Poor"      "Improved"  "Excellent" "Poor"
> (b<-factor(a,levels=c("Poor","Improved","Excellent")))
[1] Poor      Improved  Excellent Poor
Levels: Poor Improved Excellent
> (b<-factor(a,levels=c("Poor","Improved","Excellent"),labels=c("C","B","A")))
[1] C B A C
Levels: C B A

###############借助类型转换增加因子的水平
> (a<-c("A","C","B","C"))
[1] "A" "C" "B" "C"
> (b<-as.factor(a))
[1] A C B C
Levels: A B C
> b[5]<-"D"
Warning message:
In `[<-.factor`(`*tmp*`, 5, value = "D") :
  invalid factor level, NA generated

> c<-as.vector(b)
> typeof(c)
[1] "character"
> c[5]<-"D"
> (b<-as.factor(c))
[1] A C B C D
Levels: A B C D
2.导入数据
1.读文本数据
#到向量中
> Forest<-scan(file="ForestData.txt",what=double(),skip=1)   #无法成功执行,要求数据类型一样
Error in scan(file = "ForestData.txt", what = double(), skip = 1) :
  scan() expected 'a real', got 'aug'

#到数据框中
Forest<-read.table(file="ForestData.txt",header=TRUE)
str(Forest)
names(Forest)

Forest<-read.table(file="ForestData.txt",header=TRUE,stringsAsFactors=FALSE)
#取消对字符串类型按字母顺序从小到大排序

Forest<-read.table(file="ForestData.txt",header=TRUE,
 colClass=c("integer","integer","character","character","double","integer","double","double","double"))
#指定储存类型
2.外部数据导入
########################################读取SPSS数据
library(foreign)
Forest<-read.spss(file="ForestData.sav",use.value.labels = TRUE, to.data.frame = TRUE)
str(Forest)


########################读取Excel数据
install.packages("xlsx")
library("xlsx")
Forest<-read.xlsx("ForestData.xlsx",1,header=TRUE,as.data.frame=TRUE)
str(Forest)
levels(Forest$month)
Forest$month<-factor(Forest$month,order=TRUE,levels=c("jan","feb","mar","apr","may","jun","jul","aug","sep","oct","nov","dec"))
levels(Forest$month)

#######################读取数据库数据
install.packages("RODBC")
library("RODBC")
MyConn<-odbcConnectAccess2007("ForestData.accdb",uid="",pwd="")
Forest<-sqlFetch(MyConn,"Table1")
close(MyConn)
str(Forest)
3.数据合并与排列
3.1.数据合并
## Default S3 method:
merge(x, y, ...)

## S3 method for class 'data.frame'
merge(x, y, by = intersect(names(x), names(y)),
      by.x = by, by.y = by, all = FALSE, all.x = all, all.y = all,
      sort = TRUE, suffixes = c(".x",".y"),
      incomparables = NULL, ...)


authors <- data.frame(
    surname = I(c("Tukey", "Venables", "Tierney", "Ripley", "McNeil")),
    nationality = c("US", "Australia", "US", "UK", "Australia"),
    deceased = c("yes", rep("no", 4)))
books <- data.frame(
    name = I(c("Tukey", "Venables", "Tierney",
             "Ripley", "Ripley", "McNeil", "R Core")),
    title = c("Exploratory Data Analysis",
              "Modern Applied Statistics ...",
              "LISP-STAT",
              "Spatial Statistics", "Stochastic Simulation",
              "Interactive Data Analysis",
              "An Introduction to R"),
    other.author = c(NA, "Ripley", NA, NA, NA, NA,
                     "Venables & Smith"))

(m1 <- merge(authors, books, by.x = "surname", by.y = "name"))
(m2 <- merge(books, authors, by.x = "name", by.y = "surname"))

> (m1 <- merge(authors, books, by.x = "surname", by.y = "name"))
   surname nationality deceased                         title
1   McNeil   Australia       no     Interactive Data Analysis
2   Ripley          UK       no            Spatial Statistics
3   Ripley          UK       no         Stochastic Simulation
4  Tierney          US       no                     LISP-STAT
5    Tukey          US      yes     Exploratory Data Analysis
6 Venables   Australia       no Modern Applied Statistics ...
  other.author
1         <NA>
2         <NA>
3         <NA>
4         <NA>
5         <NA>
6       Ripley
> (m2 <- merge(books, authors, by.x = "name", by.y = "surname"))
      name                         title other.author nationality
1   McNeil     Interactive Data Analysis         <NA>   Australia
2   Ripley            Spatial Statistics         <NA>          UK
3   Ripley         Stochastic Simulation         <NA>          UK
4  Tierney                     LISP-STAT         <NA>          US
5    Tukey     Exploratory Data Analysis         <NA>          US
6 Venables Modern Applied Statistics ...       Ripley   Australia
  deceased
1       no
2       no
3       no
4       no
5      yes
6       no
3.2.数据排列
order(..., na.last = TRUE, decreasing = FALSE,
method = c("auto", "shell", "radix"))
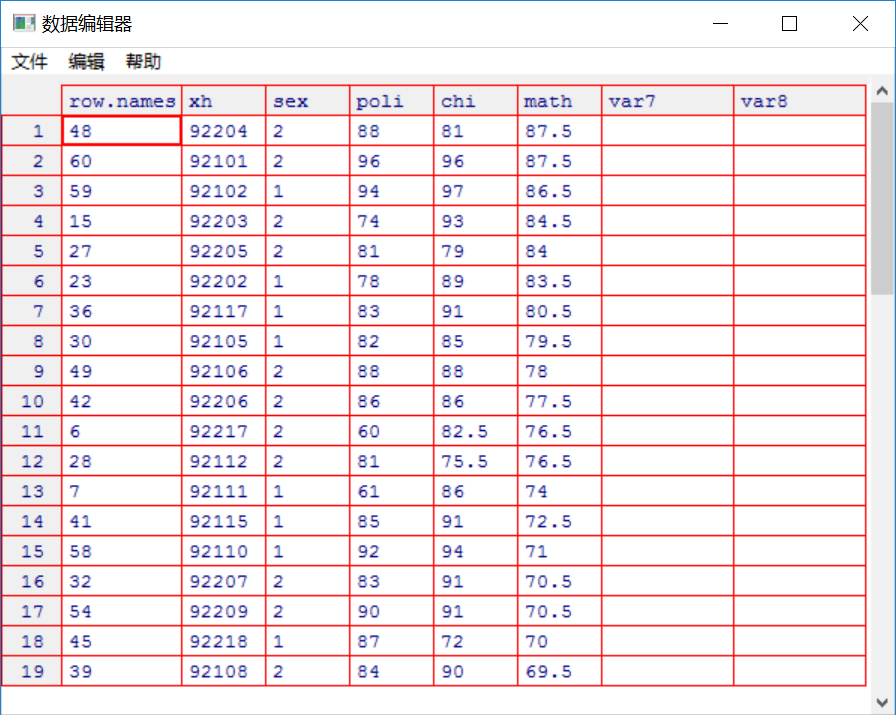
> ReportCard<-read.table(file="ReportCard1.txt",header=TRUE)
> Ord<-order(ReportCard$math,na.last=TRUE,decreasing=TRUE) #按math从高到低排列
> Ord#位置向量
[1] 48 60 59 15 27 23 36 30 49 42 6 28 7 41 58 32 54 45 39 44
[21] 52 12 40 38 10 4 29 26 56 33 43 37 31 16 3 11 9 55 50 13
[41] 47 51 53 22 24 57 18 8 19 21 34 46 2 14 20 35 5 25 17 1
> a<-ReportCard[Ord,]
> fix(a)
4.缺失数据
is.na()
is.nan()
complete.cases(matrix/dataframe)#注意判断每个观测样本是否有缺失值
> a<-ReportCard[Ord,]
> a<-is.na(ReportCard$math)
> ReportCard[a,]
     xh sex poli chi math
1 92103   2   NA  NA   NA
> a<-complete.cases(ReportCard)#判断完整观测
> ReportCard[!a,]#显示有缺失成绩的学生信息
     xh sex poli chi math
1 92103   2   NA  NA   NA
3 92142   2  NaN  70   59
生成缺失值报告
md.pattern()
> library("mice")
> md.pattern(ReportCard)
xh sex chi math poli
58 1 1 1 1 1 0 #有58个学生的成绩数据是完整的,有0个缺失值的变量
1 1 1 1 1 0 1 #有1名学生在poli这一个变量上取了确实值
1 1 1 0 0 0 3 #有一名学士在三个变量上取了缺失值
0 0 1 1 2 4 #在各变量上取缺失值的观测样本数
缺失值处理
#粗暴的删除
na.omit()
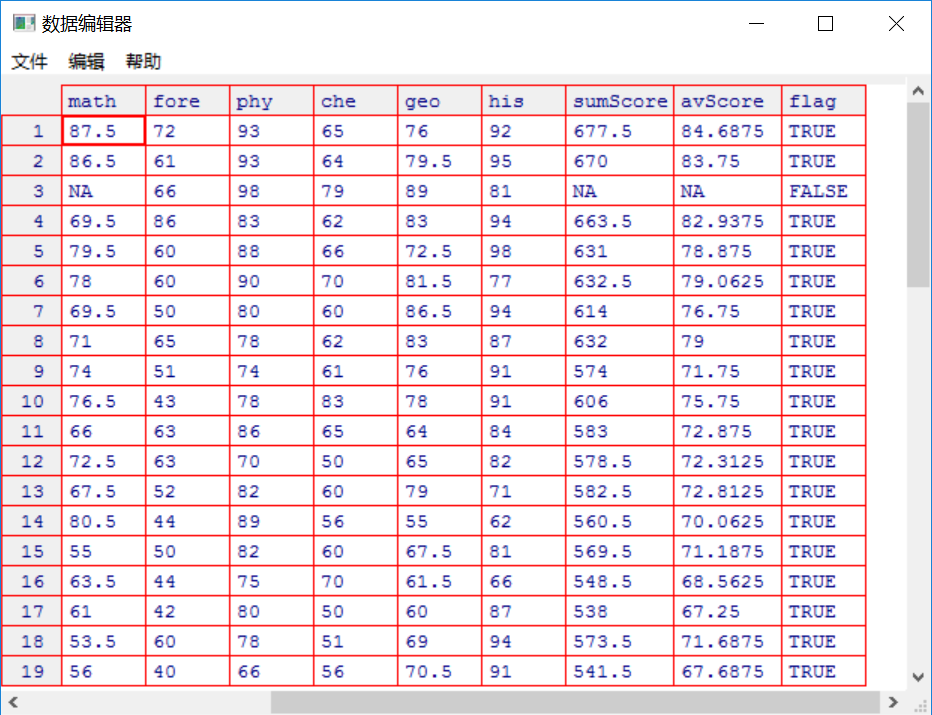
> ReportCard1<-read.table(file="ReportCard1.txt",header=TRUE)
> ReportCard2<-read.table(file="ReportCard2.txt",header=TRUE)
> ReportCard<-merge(ReportCard1,ReportCard2,by="xh")
> attach(ReportCard)
> SumScore<-poli+chi+math+fore+phy+che+geo+his
> detach(ReportCard)
> avScore<-SumScore/8
> ReportCard$sumScore<-SumScore
> ReportCard$avScore<-avScore
> sum(is.na(ReportCard$sumScore))
[1] 2
> mean(complete.cases(ReportCard))
[1] 0.9666667
5.变量计算与重编码
5.1变量计算
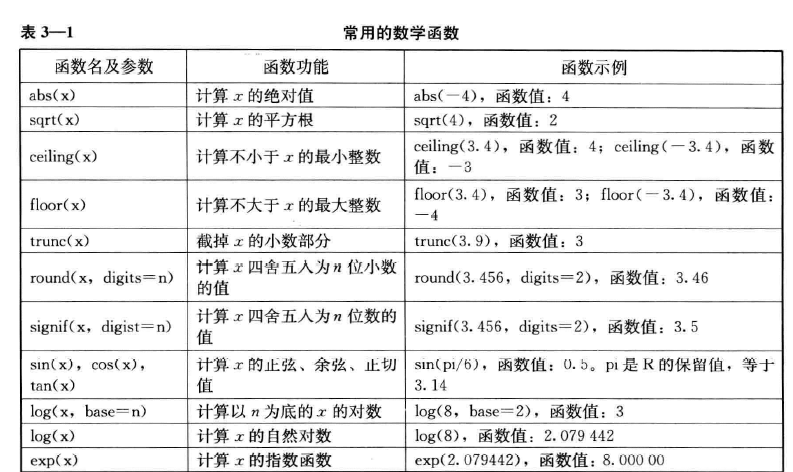
+ - * / ^ 整除:%/% 求余:%%
函数
5.2自定义函数
MyFun<-function(dataname1=x1,dataname2=x2,key=c){
 result<-merge(dataname1,dataname2,by=key)
 return(result)
}
#####调用用户自定义函数
MyData<-MyFun(dataname1=ReportCard1,dataname2=ReportCard2,key="xh")
MyData<-MyFun(ReportCard1,ReportCard2,"xh")
#调试函数
> debug(MyFun)
> MyData<-MyFun(dataname1=ReportCard1,dataname2=ReportCard2,key="xh")
debugging in: MyFun(dataname1 = ReportCard1, dataname2 = ReportCard2, key = "xh")
debug at #1: {
result <- merge(dataname1, dataname2, by = key)
return(result)
}
Browse[2]> n
debug at #2: result <- merge(dataname1, dataname2, by = key)
Browse[2]> n
debug at #3: return(result)
Browse[2]> n
exiting from: MyFun(dataname1 = ReportCard1, dataname2 = ReportCard2, key = "xh")
5.重编码
1.分组
ReportCard<-within(ReportCard,{
 avScore[avScore>=90]<-"A"
 avScore[avScore>=80 & avScore<90]<-"B"
 avScore[avScore>=70 & avScore<80]<-"C"
 avScore[avScore>=60 & avScore<70]<-"D"
 avScore[avScore<60]<-"E"
 })
flag<-ReportCard$avScore %in% c("A","B","C","D","E")
ReportCard$avScore[!flag]<-NA
2.重定义类别值
> unique(ReportCard$sex)   #获得性别的取值,检查性别取值范围是否正确
[1] 2 1
> ReportCard$sex<-factor(ReportCard$sex,levels=c(1,2),labels=c("M","F"))
> str(ReportCard$sex)
 Factor w/ 2 levels "M","F": 2 1 2 2 1 2 2 1 1 2 ...
6.数据筛选
1.按条件筛选
#提取男生(性别为M)的数据
MaleScore1<-subset(ReportCard,ReportCard$sex=="M")
Sel1<-ReportCard$sex=="M"
MaleScore1<-ReportCard[Sel1,]

#提取男生(性别为M)且平均成绩不及格(小于60分)的学生数据
MaleScore2<-subset(ReportCard,ReportCard$sex=="M" & ReportCard$avScore=="E")
2.随机筛选
sample(x, size, replace = FALSE, prob = NULL)#对数据按指定方式筛选观测样本,prob表示向量中各元素有不同的入样概率
set.seed()#希望抽样结果可以重复出现
set.seed(10000)
bh<-sample(1:60,size=30,replace=FALSE)
MySample<-ReportCard[bh,]
#以60个学生的行编号作为抽样依据,通过对行编号的随机抽样生成位置向量,实现对成绩的随机抽样
7.数据保存
write.table(ReportCard,file="ReportCard.txt",sep=" ",quote=FALSE,append=FALSE,na="NA",row.names=FALSE,col.names=TRUE)
8.控制流程
MyTable<-function(mytable){
rows<-dim(mytable)[1]
cols<-dim(mytable)[2]
DataTable<-NULL
for(i in 1:rows){
for(j in 1:mytable$freq[i]){
RowData<-mytable[i,c(1:(cols-1))]
DataTable<-rbind(DataTable,RowData)
}
}
row.names(DataTable)<-c(1:dim(DataTable)[1])
return(DataTable)
}
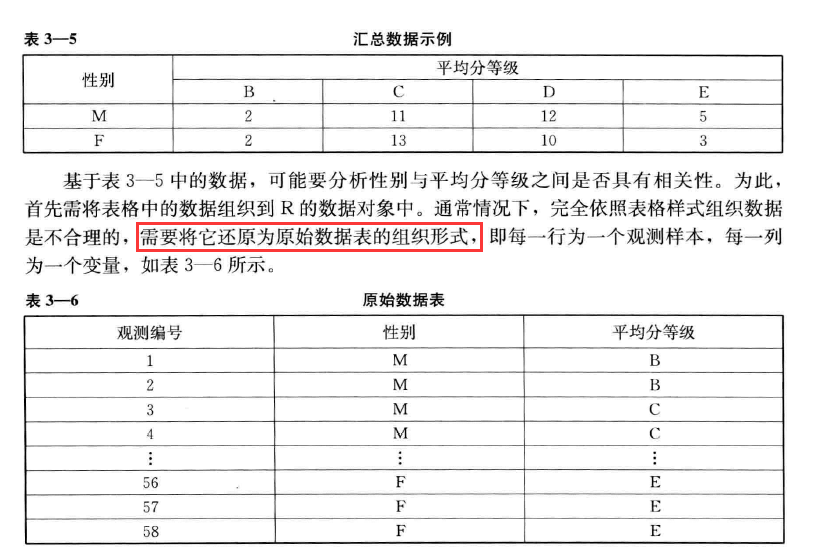
Grade<-rep(c("B","C","D","E"),times=2)
Sex<-rep(c("M","F"),each=4)
Freq<-c(2,11,12,5,2,13,10,3)
Table<-data.frame(sex=Sex,grade=Grade,freq=Freq)
MyData<-MyTable(Table)
> Table
sex grade freq
1 M B 2
2 M C 11
3 M D 12
4 M E 5
5 F B 2
6 F C 13
7 F D 10
8 F E 3

 浙公网安备 33010602011771号