
50matplotlib
import matplotlib.pyplot as plt
# plt.plot([1,2,3,4,5],[3,1,5,6,9],'ro')
# plt.show()
# x = range(1, 15)
# y = range(1, 42, 3)
# plt.plot(x, y, color='y')
# y = range(5,19)
# plt.plot(x, y, color='r', linestyle='--') # 双划线
# plt.show()
# plt.plot([1,2,3,4,5],[3,1,5,6,9],'r1')
# plt.show()
# plt.figure(facecolor='yellow', figsize=(10, 6))
# x = range(1, 15)
# y = range(1, 42, 3)
# plt.xlabel('x轴测试')
# plt.ylabel('y轴测试')
# plt.plot(x, y, marker='o', color='b')
# plt.show()
# 设置坐标轴的刻度
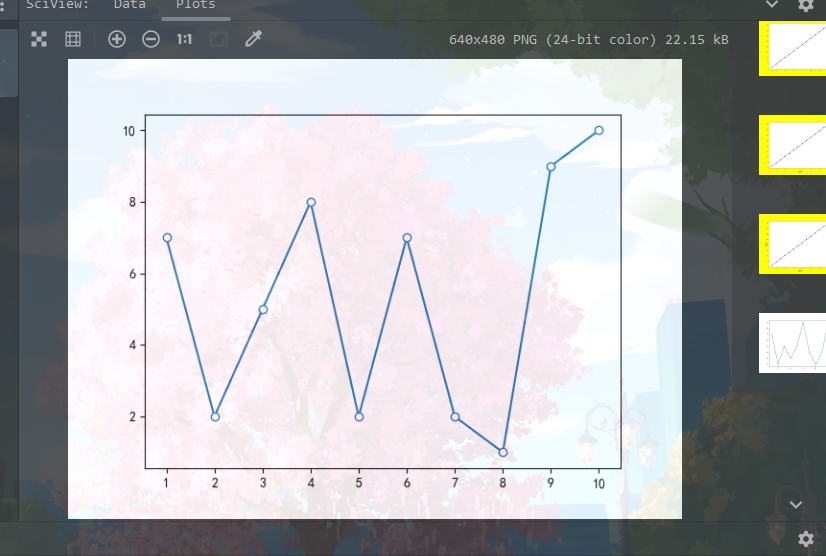
import matplotlib.pyplot as plt
import random
x = [i for i in range(1,11)]
y = [random.randint(1,10) for _ in range(10)]
plt.plot(x,y, marker='o',mfc='w')
plt.xticks(range(1,11))
plt.yticks(range(1,11))
plt.show()
本文来自博客园,作者:__username,转载请注明原文链接:https://www.cnblogs.com/code3/p/17020002.html

 浙公网安备 33010602011771号