基于ELK的传感器数据分析练习
Sensor Data Analytics Application
本案例参考自https://github.com/pranav-shukla/learningelasticstack/tree/master/chapter-10
ELK版本为5.6.12
数据构成
下面是sql的三个表通过关联sensorType得出的数据
| sensorType | customer | department | buildingName | room | floor | locationOnFloor | latitude | longitude |
|---|---|---|---|---|---|---|---|---|
| Temperature | Abc Labs | R & D | 222 Broadway | 101 | Floor1 | C-101 | 40.710936 | -74.0085 |
下面是sensor数据
| sensor_id | time | value |
|---|---|---|
| 1 | 1511935948000 | 21.89 |
在导入elasticsearch前把上面两种数据进行整合,即一条数据包含上面12个field。
数据模型设计
mysql表数据脚本可以到之前提到的GitHub下载。
POST _template/sensor_data_template
{
	"template" : "sensor_data*", # 这里6.0可能不一样
	"settings": {
		"number_of_replicas": "1",
		"number_of_shards": "5"
	},
	"mappings": {
		"doc": {
			"properties": {
				"sensorId": {
					"type": "integer"
				},
				"sensorType": {
					"type": "keyword",
					"fields": {
						"analyzed": {
							"type": "text"
						}
					}
				},
				"customer": {
					"type": "keyword",
					"fields": {
						"analyzed": {
							"type": "text"
						}
					}
				},
				"department": {
					"type": "keyword",
					"fields": {
						"analyzed": {
							"type": "text"
						}
					}
				},
				"buildingName": {
					"type": "keyword",
					"fields": {
						"analyzed": {
							"type": "text"
						}
					}
				},
				"room": {
					"type": "keyword",
					"fields": {
						"analyzed": {
							"type": "text"
						}
					}
				},
				"floor": {
					"type": "keyword",
					"fields": {
						"analyzed": {
							"type": "text"
						}
					}
				},
				"locationOnFloor": {
					"type": "keyword",
					"fields": {
						"analyzed": {
							"type": "text"
						}
					}
				},
				"location": {
					"type": "geo_point"
				},
				"time": {
					"type": "date"
				},
				"reading": {
					"type": "double"
				}
			}
		}
	}
}
Logstash配置
下面logstash配置会从sensor_data_http_input获取数据,然后filter从mysql中拉去信息来补充数据,成为lookupResult field,这需要mutate来展开,最后删除三个多余的fields。
jdbc_streaming插件的安装
./bin/logstash-plugin install logstash-filter-jdbc_streaming
input {
  http {
  	host => "localhost"
  	port => 8080
    id => "sensor_data_http_input"
    user => "sensor_data"
    password => "sensor_data"
  }
}

filter {
  jdbc_streaming {
    jdbc_driver_library => "/Users/flyang/Documents/big_data/hive-1.1.0-cdh5.11.2/lib/mysql-connector-java-5.1.46.jar"
    jdbc_driver_class => "com.mysql.jdbc.Driver"
    jdbc_connection_string => "jdbc:mysql://localhost:3306/sensor_metadata"
    jdbc_user => "root"
    jdbc_password => "password"
    statement => "select st.sensor_type as sensorType, l.customer as customer, l.department as department, l.building_name as buildingName, l.room as room, l.floor as floor, l.location_on_floor as locationOnFloor, l.latitude, l.longitude from sensors s inner join sensor_type st on s.sensor_type_id=st.sensor_type_id inner join location l on s.location_id=l.location_id where s.sensor_id= :sensor_identifier"
    parameters => { "sensor_identifier" => "sensor_id"}
    target => lookupResult
  }

  mutate {
    rename => {"[lookupResult][0][sensorType]" => "sensorType"}
    rename => {"[lookupResult][0][customer]" => "customer"}
    rename => {"[lookupResult][0][department]" => "department"}
    rename => {"[lookupResult][0][buildingName]" => "buildingName"}
    rename => {"[lookupResult][0][room]" => "room"}
    rename => {"[lookupResult][0][floor]" => "floor"}
    rename => {"[lookupResult][0][locationOnFloor]" => "locationOnFloor"}
    add_field => {
      "location" => "%{lookupResult[0]latitude},%{lookupResult[0]longitude}"
    }
    remove_field => ["lookupResult", "headers", "host"]
  }

}

output {
  elasticsearch {
    hosts => ["localhost:9200"]
    index => "sensor_data-%{+YYYY.MM.dd}"
  }
}
测试代码
将上面的output换成
output {stdout {} }

发送信息到logstash的监听端口
curl -XPOST -u sensor_data:sensor_data --header "Content-Type:application/json" "http://localhost:8080/" -d '{"sensor_id":1,"time":1512102540000,"reading":16.24}'
搭建好Logstash后通过脚本发送数据到elasticsearch后就可以使用Kibana进行分析了。
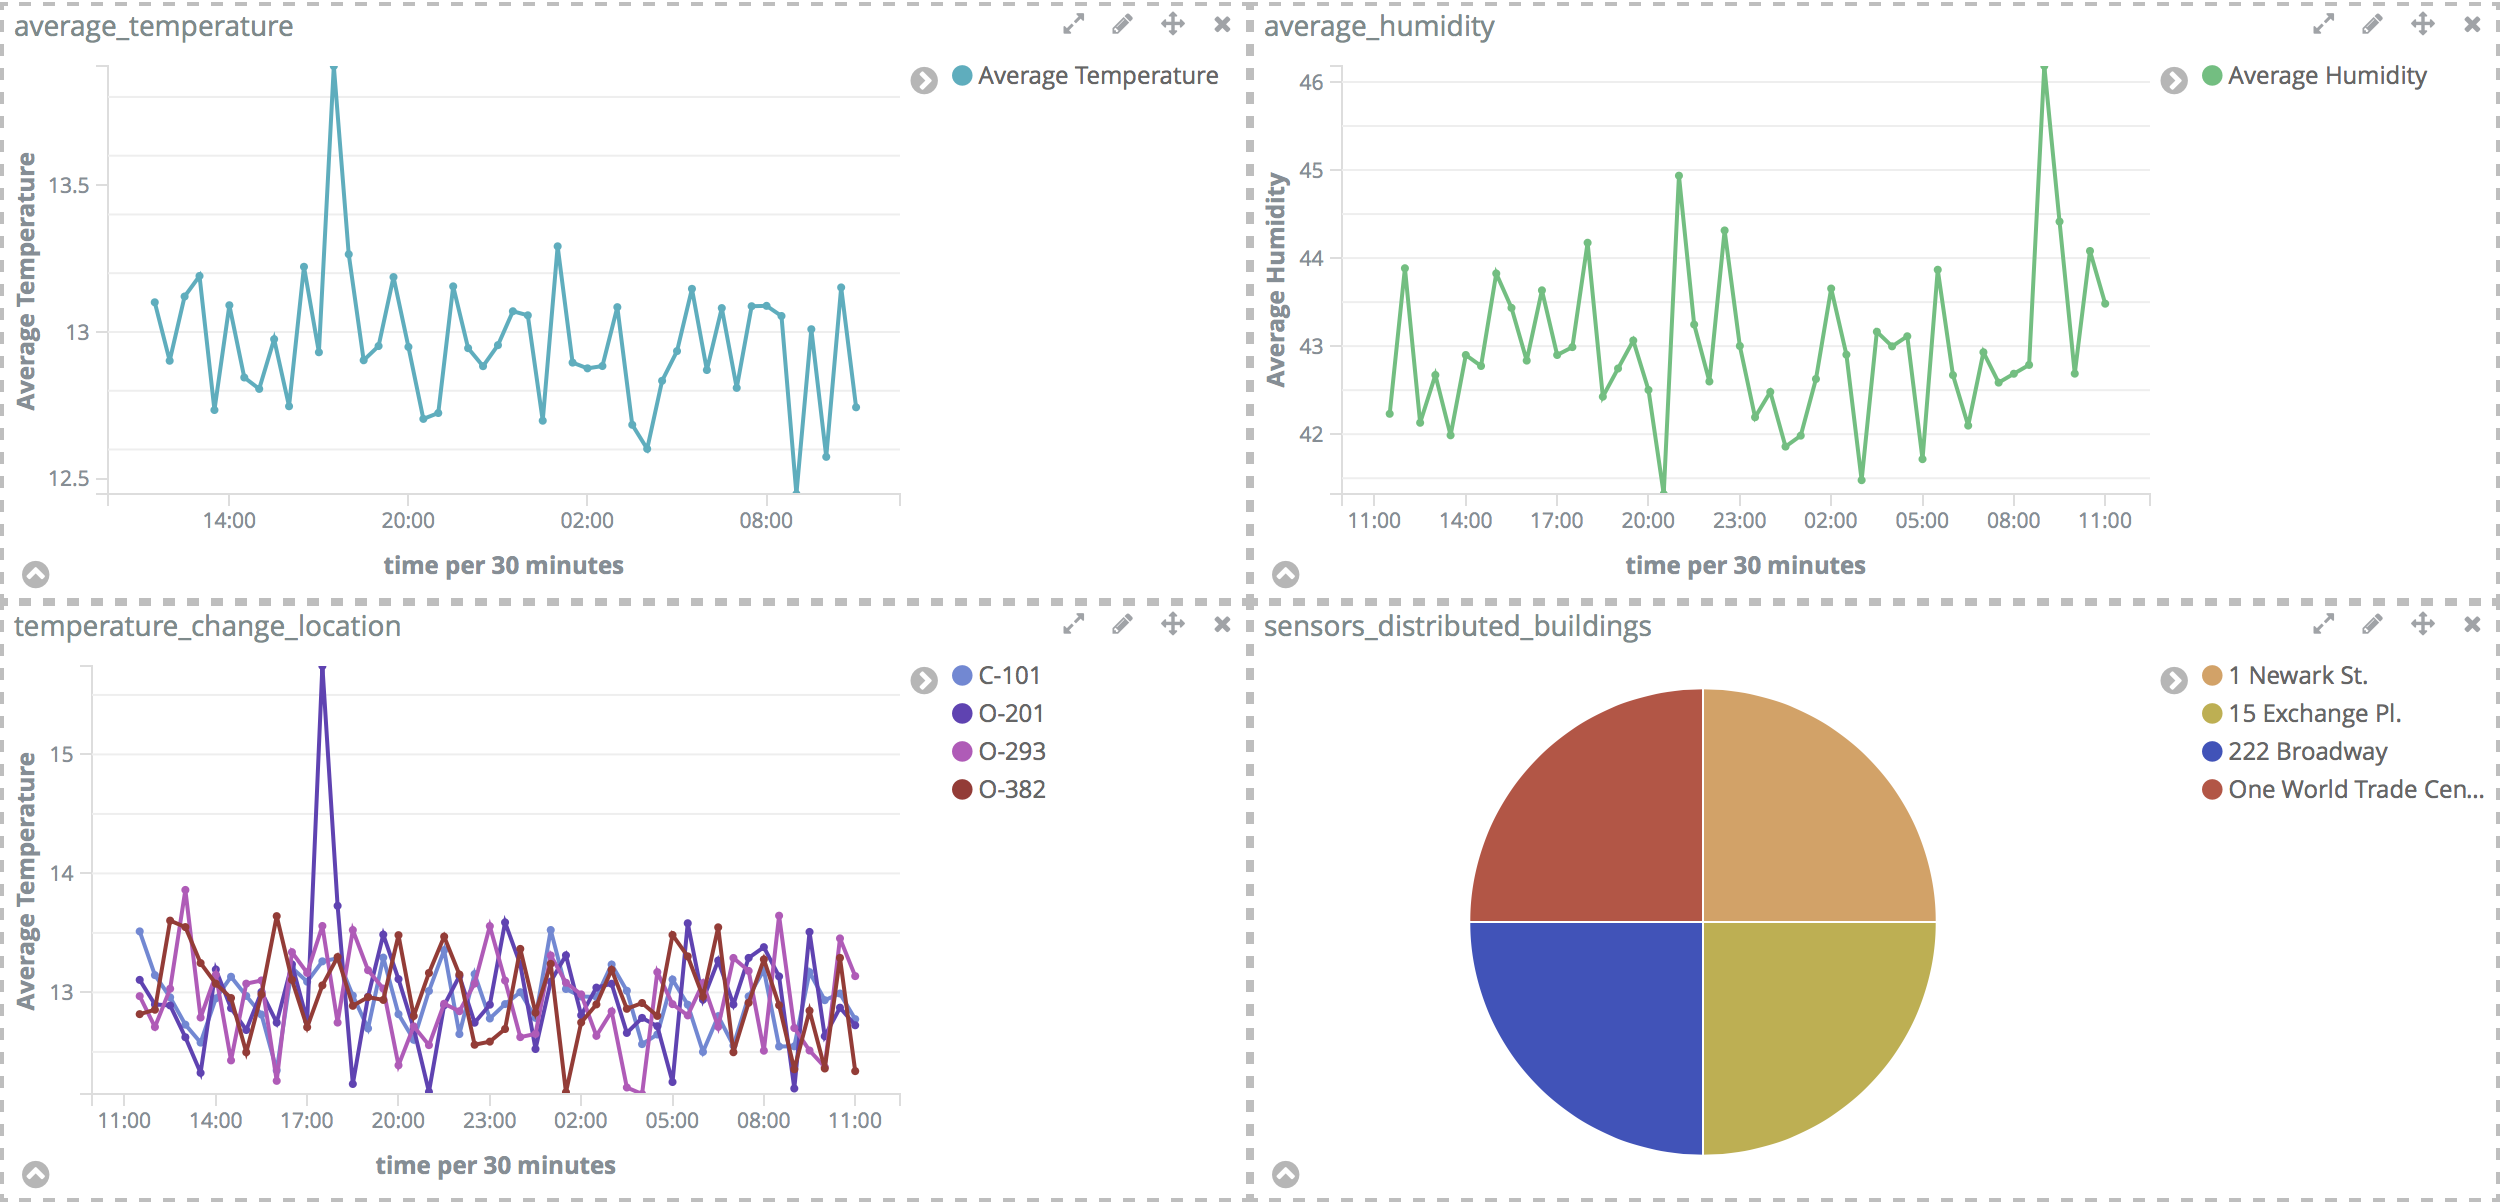
Kibana可视化
打开kibana,在management中新增index pattern:sensor_data*,选择Time Filter field name为time。下面是目标:
- How does the average temperature/humidity change over time?
- How do temperature change at each location over time?
- Can I visualize temperature and humidity over a map?(地图精度有限)
- How are the sensors distributed across buildings?

 浙公网安备 33010602011771号