

Cross-Correlation of Phase-Lagged Waves
phase shift of lift and displacement, viv post processing
% cross-correlation of lift and displacement, viv post processing
% https://www.mathworks.com/help/matlab/ref/xcorr.html?searchHighlight=xcorr&s_tid=doc_srchtitle#mw_e4c2e0e1-c21b-46e0-a296-82a5ca8429ad
% input variable: phase shift (tau), i.e. tau=[0.0:0.001:1]
% output: R (vector or array)
% find the phase (tau) for max R
clear;
clc;
%% read data
data=xlsread('gap1Ur8.xlsx'); % time, displacement, lift, drag
time = data(1000:10000,1); %time
Y=data(1000:10000,2); % 1000-1e4rows, 2nd column; displacement vector
F=data(1000:10000,3); % lift vector
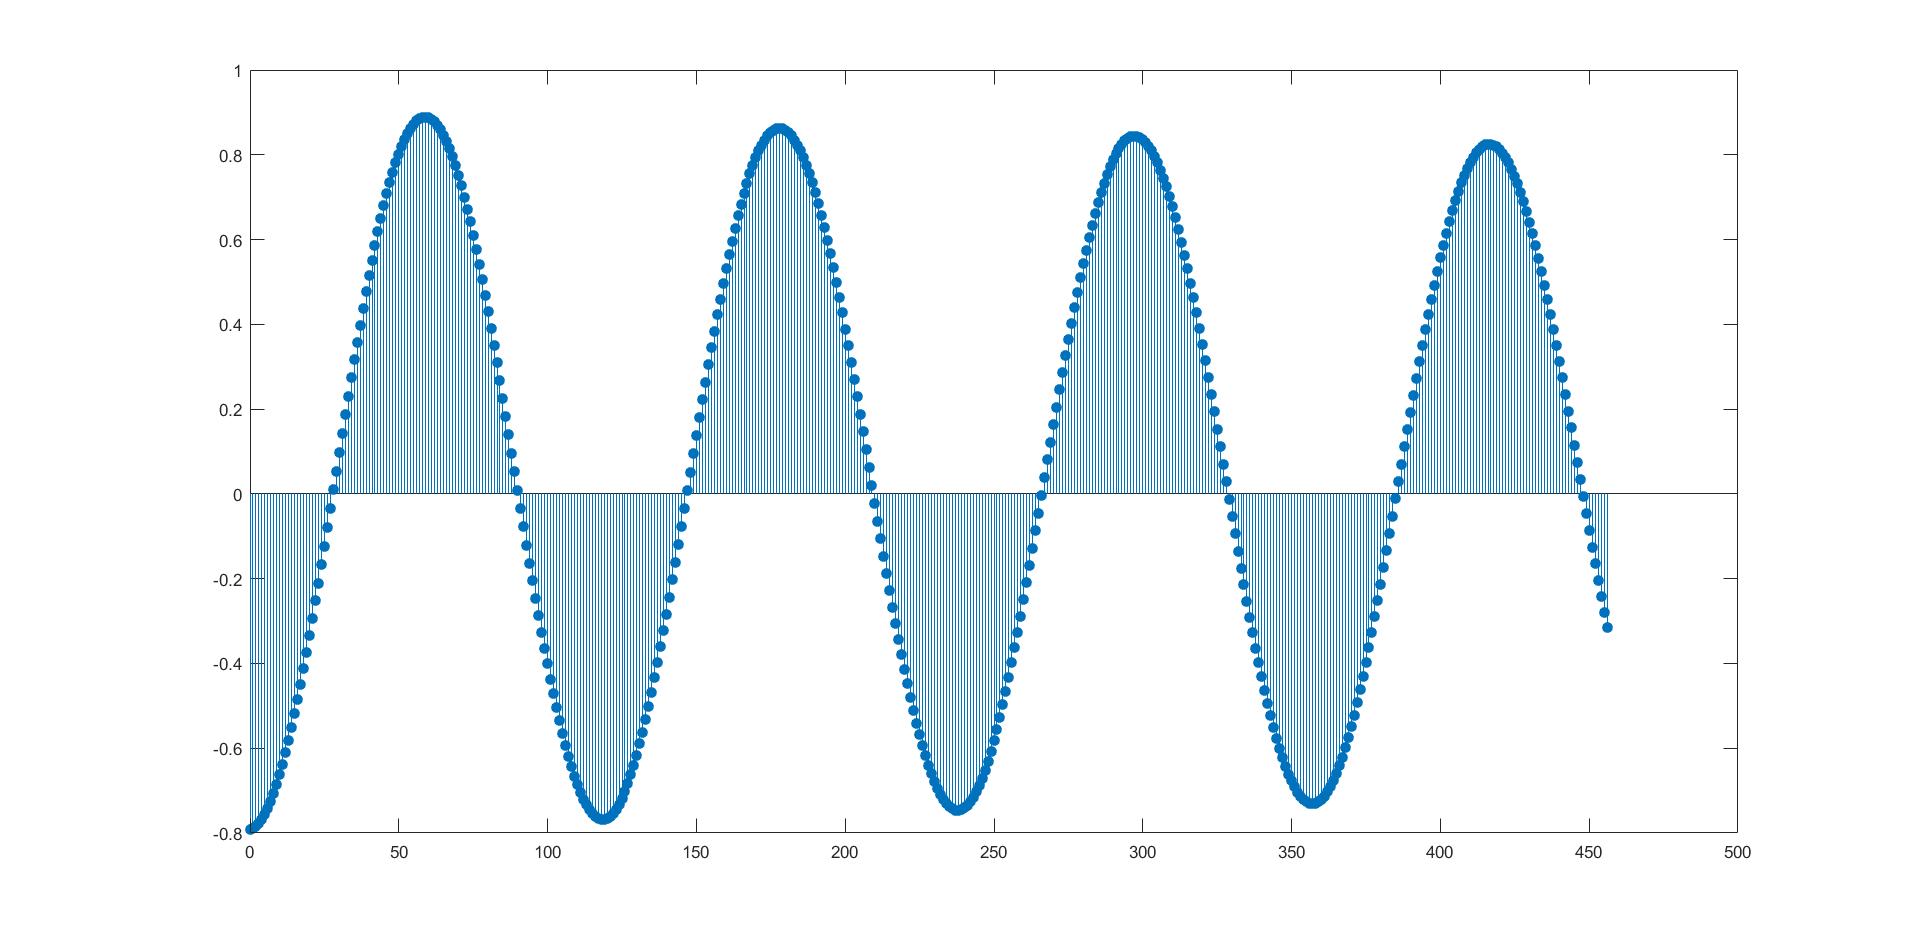
T = 1.141; % period of displacement; T/tau=228 sample points per period
[xc,lags] = xcorr(Y,F,456,'coeff'); % 2 periods data
stem(lags(457:end),xc(457:end),'filled')
hold on
%figure(2);
plot (time(1:228),Y(1:228))
%plot (t,y)
%plot([2.5 2.55],[-1 1])
ax = gca;
% ax.XTick = 0:8:456;
** Cross-Correlation of Phase-Lagged Sine Wave
This example shows how to use the cross-correlation sequence to estimate the phase lag between two sine waves. The theoretical cross-correlation sequence of two sine waves at the same frequency also oscillates at that frequency. Because the sample cross-correlation sequence uses fewer and fewer samples at larger lags, the sample cross-correlation sequence also oscillates at the same frequency, but the amplitude decays as the lag increases.
Create two sine waves with frequencies of 2π/10 rad/sample.
The starting phase of one sine wave is 0, while the starting phase of the other sine wave is −π radians.
Add N(0,0.25^2) white noise to the sine wave with the phase lag of π radians.
Set the random number generator to the default settings for reproducible results.
t = 0:99;
x = cos(2*pi*1/10*t);
y = cos(2*pi*1/10*t-pi)+0.25*randn(size(t));
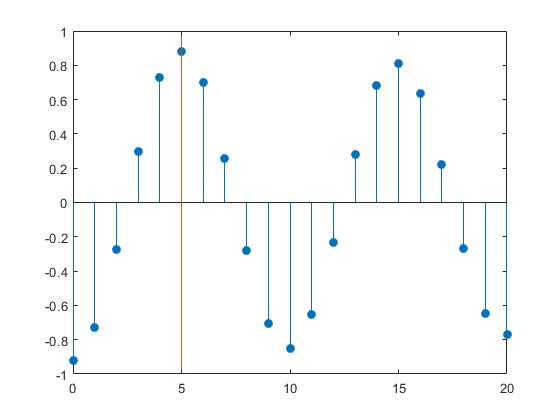
Obtain the sample cross-correlation sequence for two periods of the sine wave (10 samples).
Plot the cross-correlation sequence and mark the known lag between the two sine waves (5 samples).
[xc,lags] = xcorr(y,x,20,'coeff');

stem(lags(21:end),xc(21:end),'filled')

hold on
plot([5 5],[-1 1])

ax = gca;
ax.XTick = 0:5:20;
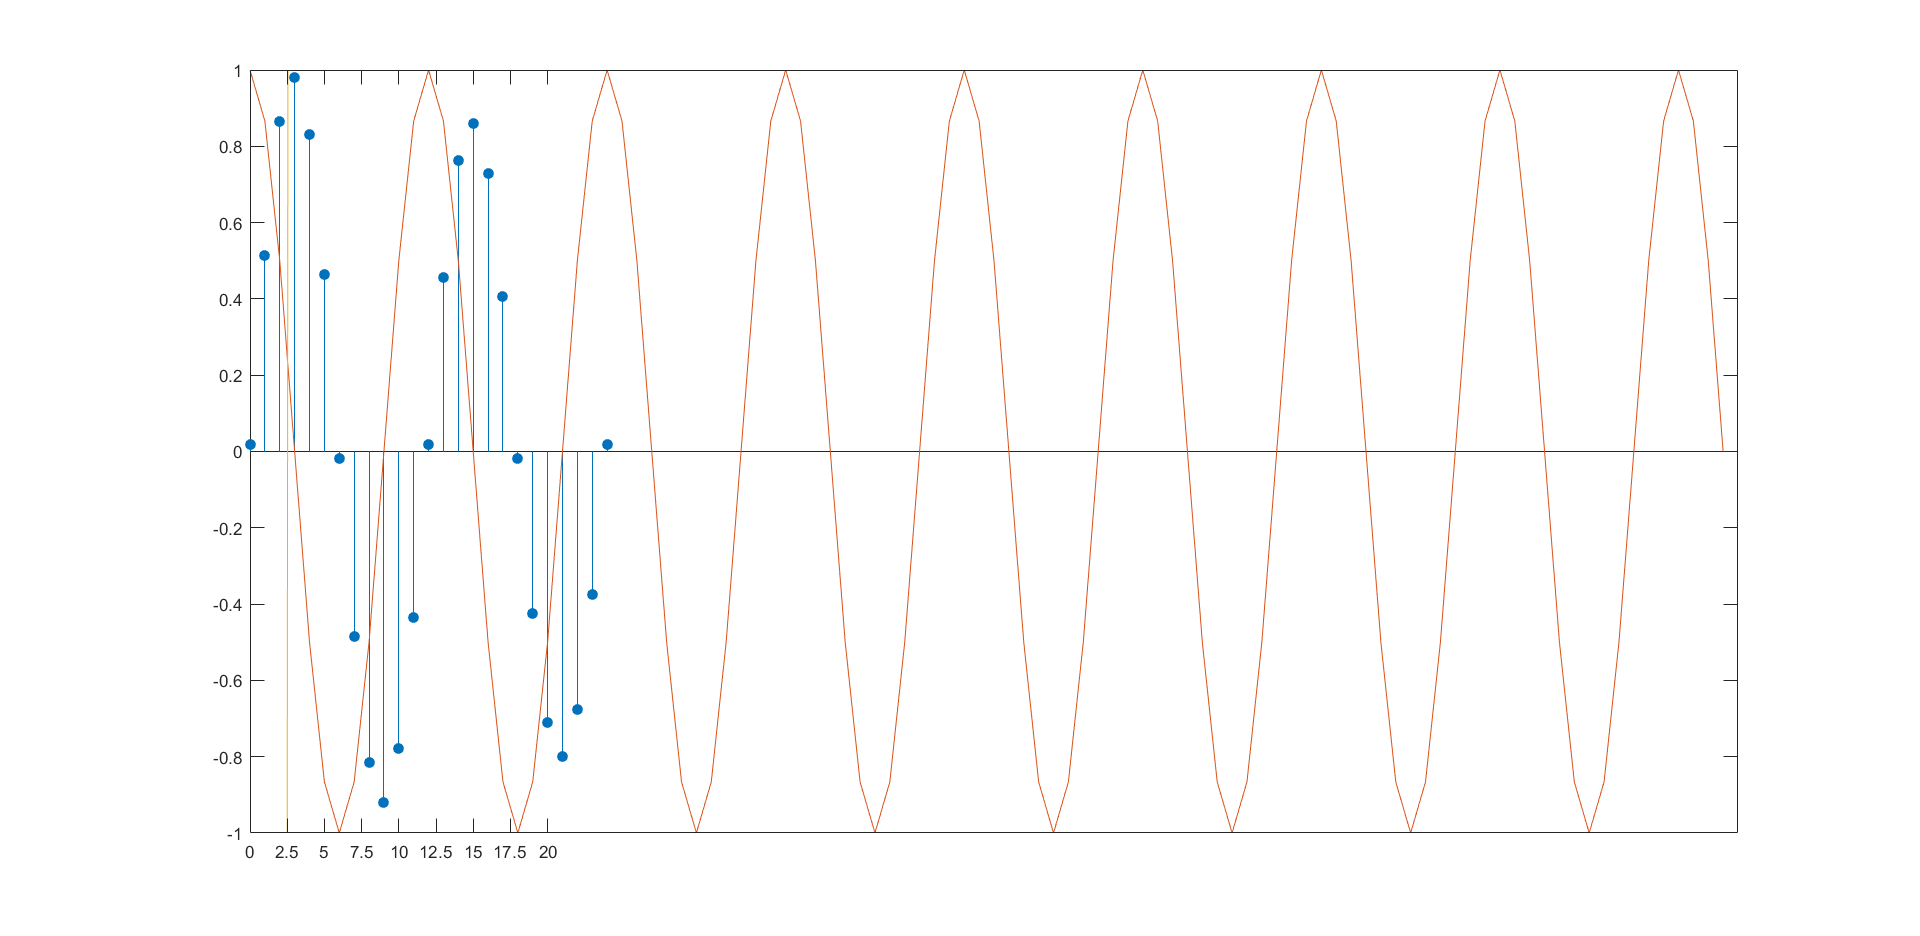
phase lag of sine and cosine function
% phase lag of sine and cosine function
% https://www.mathworks.com/help/signal/ug/cross-correlation-of-phase-lagged-sine-wave.html
rng default

t = 0:99;
x = cos(2*pi*1/12*t);  % 12 samples in one periods
y = sin(2*pi*1/12*t);
[xc,lags] = xcorr(y,x,24,'coeff');

stem(lags(25:end),xc(25:end),'filled')

hold on
plot (t,x)
%plot (t,y)
plot([2.5 2.55],[-1 1])

ax = gca;
ax.XTick = 0:2.5:20;
https://www.mathworks.com/help/signal/ug/cross-correlation-of-phase-lagged-sine-wave.html

 浙公网安备 33010602011771号