
Q-criterion- definition and post-processing
Q-criterion
Table of Contents
1 Q-Criterion
1.1 Q-criterion– Hunt, Wray & Moin 1988
J. Fluid. Mech. 366, 87–108. Hunt, J. C. R., Wray, A. & Moin, P. 1988 Eddies, stream, and convergence zones in turbulent flows. Center for Turbulence Research Report CTR-S88.
velocity gradient, ∇ v ∇ v = S + Ω where, S is rate-of-strain tensor, and Ω is vorticity tensor
\begin{equation} S= 0.5[\nabla v + (\nabla v)^T] \end{equation}\begin{equation} \Omega = 0.5[\nabla v - (\nabla v)^T] \end{equation}
Q-criterion: Q=0.5(||Ω||2 - ||S||2)
Q> 0
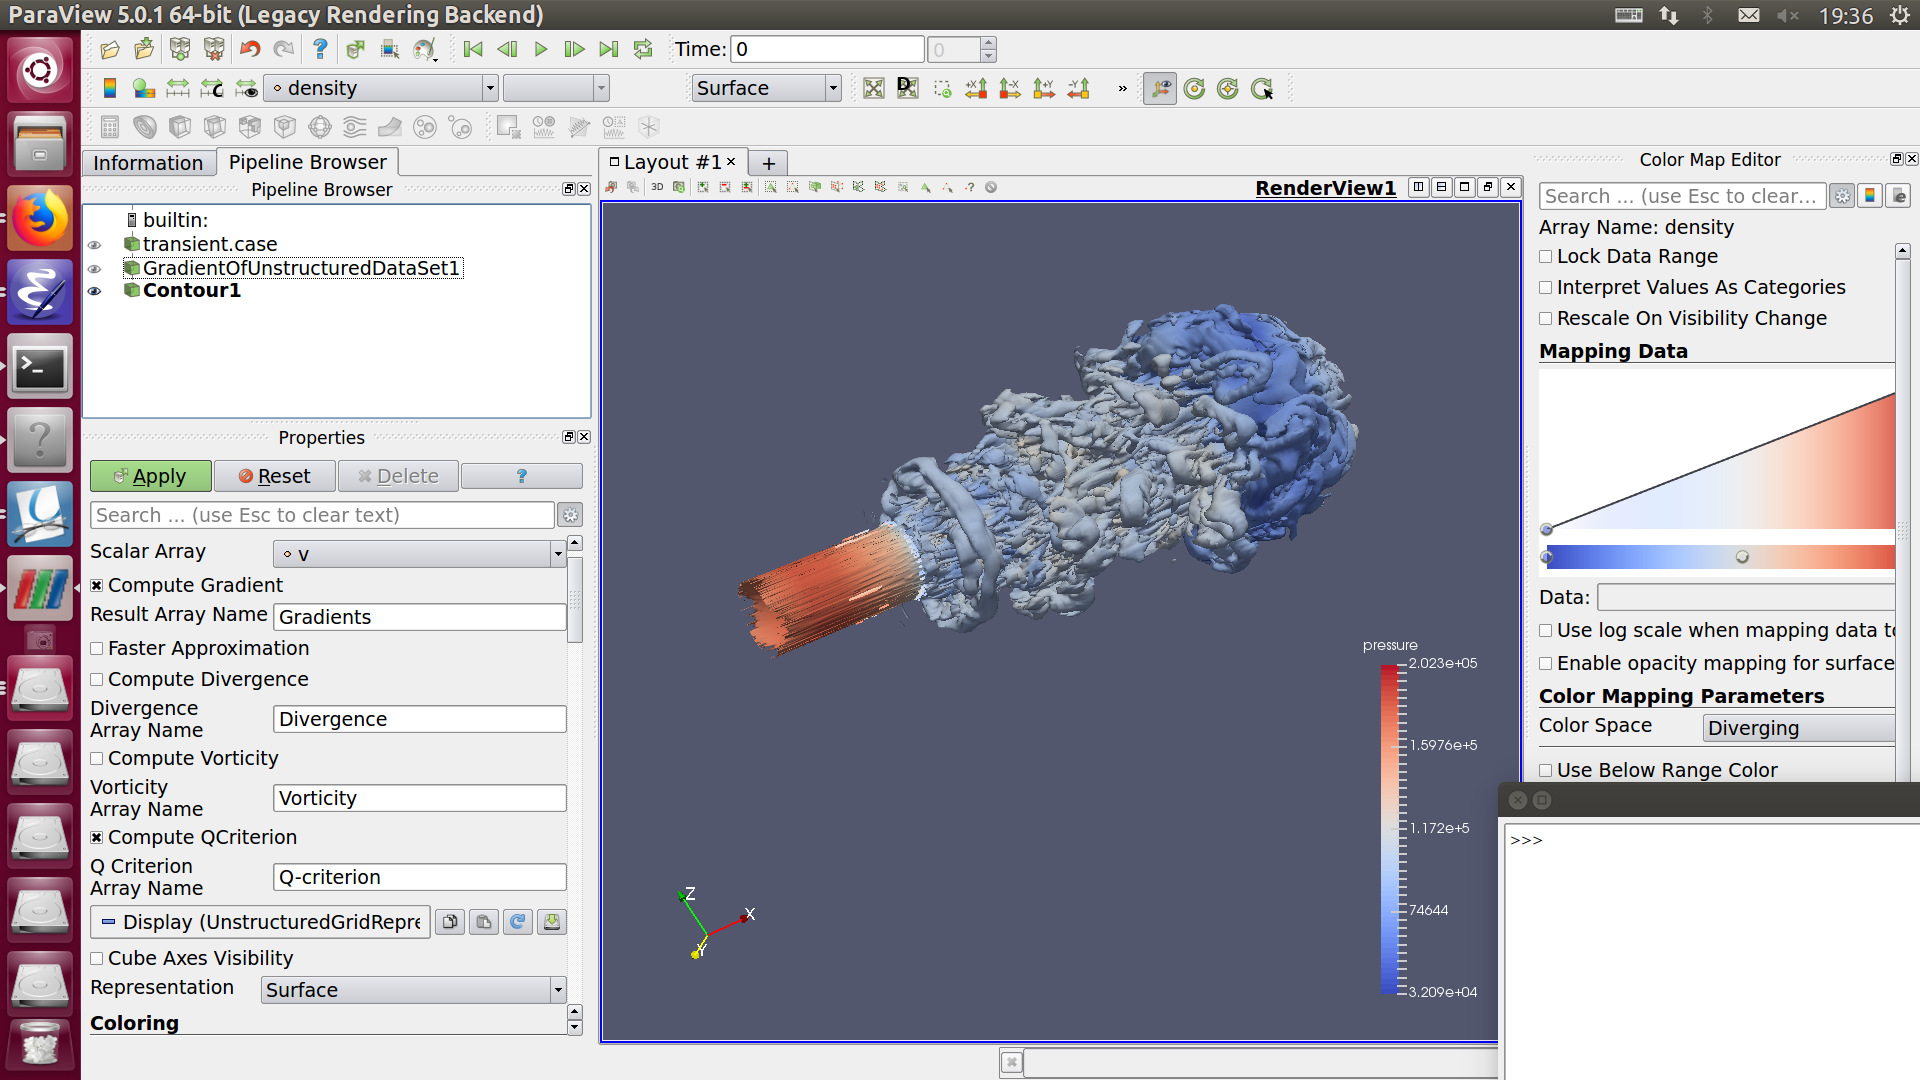
1.2 Q criterion-paraview
Qcriterion of a wind turbine 
- isosurface
- a 3D surface representation of points with equal values in a 3D data distribution. Is the 3D equivalent of a contour line.
setup details
1.3 Q-Criterion with Tecplot
a) analysze/calculate variables/Q criterion
b) iso-surface/details
define iso-surface using: criterion
draw iso-surafces at : specified value
value: 0-0.5

http://download.tecplot.com/videos/3602017R2-QCriterion.mp4
Q-Criterion is an important calculation used to identify vortices.
In this video we’ll show you how to calculate Q-Criterion, plot the results, and compare the performance of Plot3D and SZL file formats for this work.
In this example, we are using the final time-step of a transient simulation of a wind turbine. An overset mesh was used and is composed of 5863 zones with a total of 263 million elements. The output is in Plot3D file format and the grid and solution files combine for a total of 21 GB.
To calculate Q-Criterion:
>> Analyze > Calculate Variables and select Q Criterion from the list.
The Calculate Variables dialog has a unique feature called Calculate-on-Demand – if you check this toggle, the formula will simply be registered and the calculation will not occur until it is required. This can save a significant amount of time particularly for a data set such as this which has many zones, because the calculation will only be performed on the zones required for the desired plot.
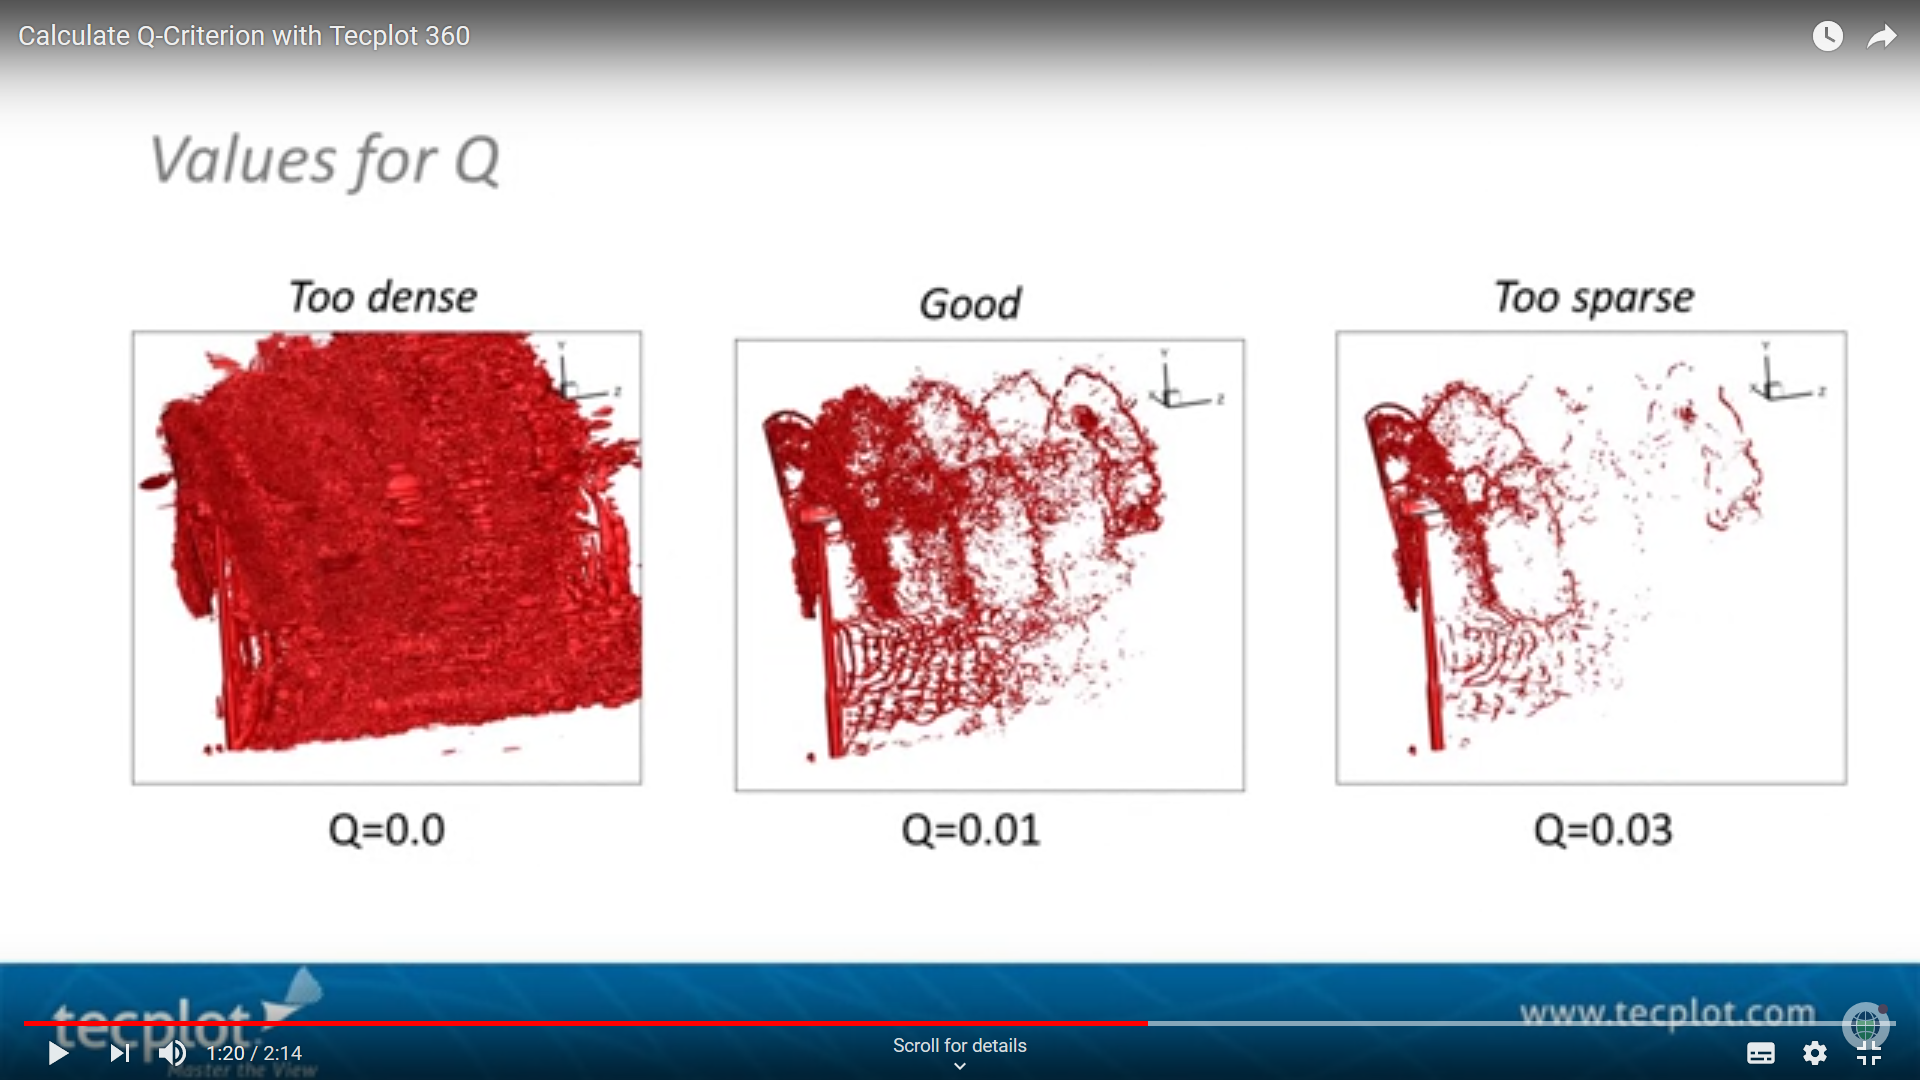
Use an iso-surface, at a positive value near zero, to view the resulting Q-Criterion calculation. Some adjustment of the iso-surface value will be required to see the vortices. Increasing Q reduces the complexity of the iso-surface, but too high of a value makes an iso-surface that is too sparse. It is important to find a value that results in an iso-surface that is neither too dense nor too sparse.
When run in batch mode, the total time to load the data, calculate Q and generate an image with an iso-surface at Q=0.01, without Calculate-on-Demand, was 517 seconds for the Plot3D file and 409 seconds for the SZL file. Using Calculate-on-Demand was 27% faster, taking 372 seconds for the Plot3D file and 299 seconds for the SZL file. Additionally the SZL file is 35% smaller at only 13GB
https://www.youtube.com/watch?v=LmqQtTAsTiA

 浙公网安备 33010602011771号