
gnuplot plotting examples
input data file
1. default separator is white space ' '
2. for comma separated data, e.g.
1, 2, 3
0.5, 0.6, 0.7
add a command line:
> set datafile separator ","
add dashed vertical line
# vertical line
set arrow 1 from 5000,-0.75 to 5000,-0.25 nohead dt "."
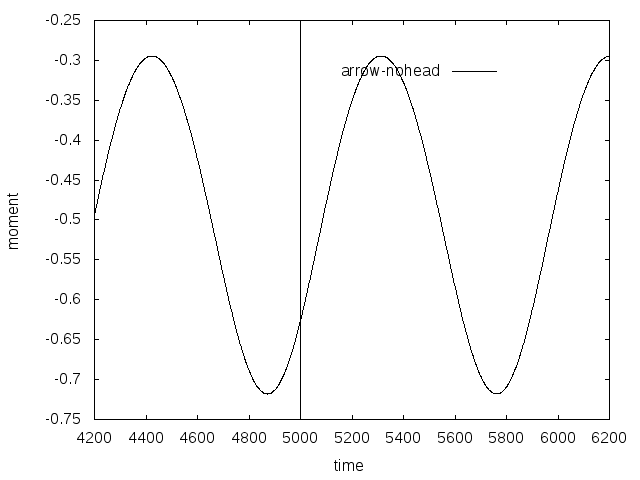
#set terminal pdf
#set output 'c_p_tsr5.5_sine_udf_e387.pdf'
set terminal postscript eps enhanced color font 20 size 8in, 6in
set out 'vertical_line.eps'
#set terminal X11
set autoscale
unset log
unset label
unset pm3d
set key at graph .8, .9
set key spacing 1.2
set xtic auto
set ytic auto
set xlabel  "time"
set xrange [*:*]
# r0 initial pulse
set yrange [*:*]
set ylabel "moment"
set style line 1 lt 1 lc rgb "black" lw 1
set style line 2 lt 2 lc rgb "red" lw 4
set style line 3 lt 3 lc rgb "purple" lw 3
set style line 4 lt 4 lc rgb "blue" lw 3
set style line 5 lt 5 lc rgb "black" lw 2
set style line 6 lt 6 lc rgb "brown" lw 3
# vertical line
set arrow 1 from 5000,-0.75 to 5000,-0.25 nohead dt "."
plot "cm-sine-udf.out"  using 1:3 t "arrow-nohead" ls 1 with lines
two figures side by side
set grid
# multiplot
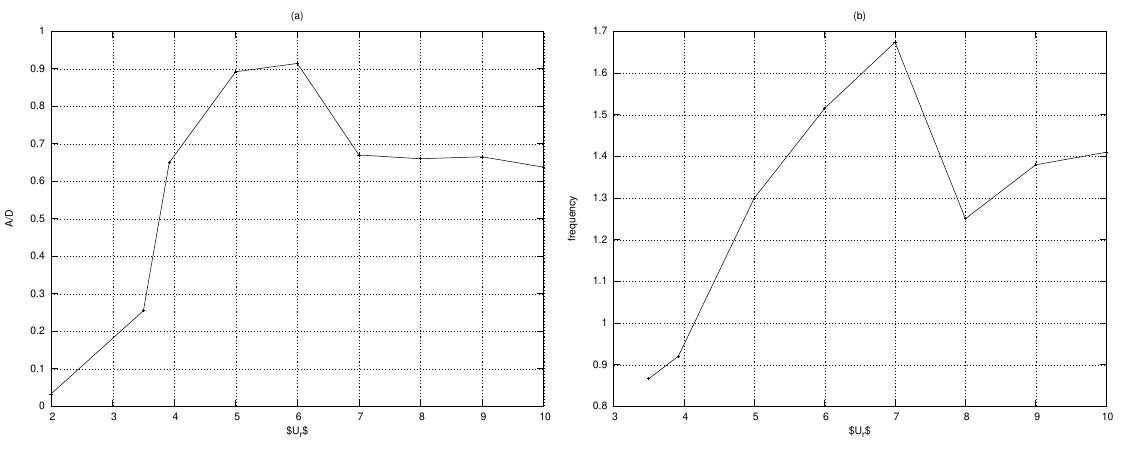
#set terminal svg  font "Arial"enhanced size 700, 600
#set output "multiplt1.svg"

# eps
set terminal postscript eps font 10 size 7.5in, 6in
set out 'multiplt1.eps'


set style line 1  linecolor rgb "black"  linewidth 1.000 lt 1 pointtype 1 ps 0.5
set style line 2  linecolor rgb "black"  linewidth 2.000 lt 2 pointtype 3 ps 0.

set size 1.0, 0.5
set origin 0.0, 0.0
set multiplot

set grid
unset key
set angles radians
set samples 250

#####################  -- figure 1
set xtic auto
set ytic auto
set size 0.5, 0.5
set origin 0.0, 0.0
set title "(a)"
set xlabel "$U_r$"
set ylabel "A/D"
set label 1 "Damping =.1,.2,.3,.4,.5,.707,1.0,2.0" at .14,17
set xrange [*:*]
set yrange [*:*]
plot  "amp.txt"  using 1:8 t "0.0"  ls 1 with linespoints

#######################  -- figure 2
set xtic auto
set ytic auto
set size 0.5,0.5
set origin 0.5,0.0
set title "(b)"
set label 1 ""
set xlabel "$U_r$"
set ylabel "frequency"
set xrange [*:*]
set yrange [*:*]
plot  "fre.txt"  using 1:2 title "0.005"  ls 1 with linespoints

unset multiplot
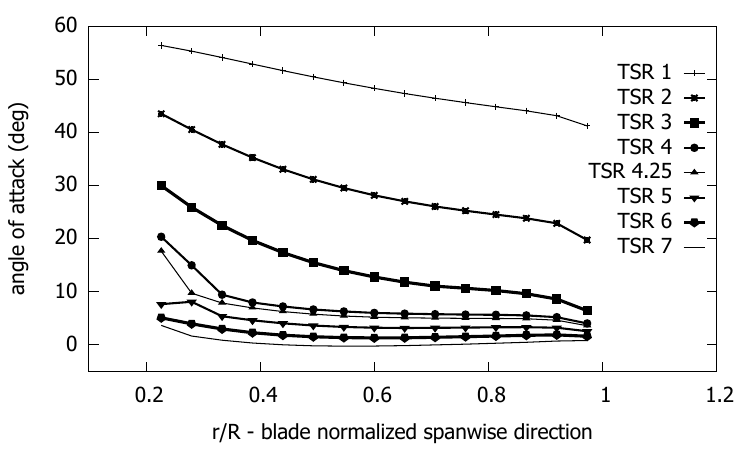
single plot
Code:
# set terminal jpeg
# set output 'alfa_epp_a7.jpg'
# set terminal postscript eps font 20
# set out 'alfa_tsr_e387.eps'
set terminal pdf
set output 'alfa_tsr_e387.pdf'
# set terminal X11
set autoscale
unset log
unset label
unset pm3d
set key ins vert
set key samplen 1
set key at graph 1, 0.9
set key spacing 1
set xtic auto
set ytic auto
set xlabel  "r/R - blade normalized spanwise direction"
set xrange [0.1:1.2]
# r0 initial pulse
set yrange [-5:*]
set ylabel "angle of attack (deg)"
set style line 1  linecolor rgb "black"  linewidth 1.000 lt 1 pointtype 1 ps 0.5
set style line 2  linecolor rgb "black"  linewidth 2.000 lt 2 pointtype 3 ps 0.5
set style line 3  linecolor rgb "black"  linewidth 3.000 lt 3 pointtype 5 ps 0.5
set style line 4  linecolor rgb "black"  linewidth 2.000 lt 4 pointtype 7 ps 0.5
set style line 5  linecolor rgb "black"  linewidth 1.000 lt 5 pointtype 9 ps 0.5
set style line 6  linecolor rgb "black"  linewidth 2.000 lt 6 pointtype 11 ps 0.5
set style line 7  linecolor rgb "black"  linewidth 3.000 lt 7  pointtype 13 ps 0.5
set style line 7  linecolor rgb "black"  linewidth 3.000 lt 7  pointtype 15 ps 0.5

plot "e387_bem/fort.101"  using 1:2 t "TSR 1" ls 1 with linespoints,\
"e387_bem/fort.105"  using 1:2 t "TSR 2" ls 2 with linespoints ,\
"e387_bem/fort.110" using 1:2 t "TSR 3" ls 3 with linespoints ,\
"e387_bem/fort.114" using 1:2 t "TSR 4" ls 4 with linespoints ,\
"e387_bem/fort.115" using 1:2 t "TSR 4.25" ls 5 with linespoints ,\
"e387_bem/fort.118" using 1:2 t "TSR 5" ls 6 with linespoints ,\
"e387_bem/fort.122" using 1:2 t "TSR 6" ls 7 with linespoints ,\
"e387_bem/fort.127" using 1:2 t "TSR 7" ls 8 with lines
output:
Code
#set terminal jpeg
#set output 'alfa.jpg'
set terminal postscript eps font 24
set out 'U_vs_X_tsr5.eps'
#set terminal X11
set autoscale
unset log
unset label
unset pm3d
set key at graph .99, .58
set key spacing 1
set xtic auto
set ytic auto
set xlabel "Normalized axial distance, X/D"
set xrange [*:*]
# r0 initial pulse
set yrange [*:*]
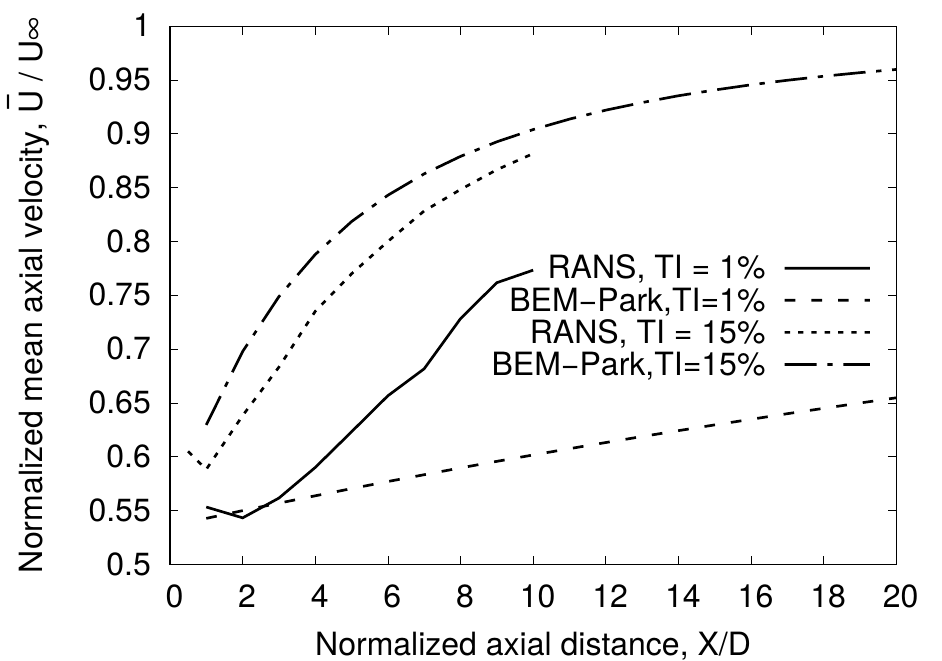
set ylabel "Normalized mean axial velocity, ~U{0.8-} / U{/Symbol \245}"
set style line 1 lt 1 lc rgb "black" lw 4 pt 1 ps 2
set style line 2 lt 2 lc rgb "black" lw 4 pt 3 ps 2
set style line 3 lt 3 lc rgb "black" lw 4 pt 5 ps 2
set style line 4 lt 4 lc rgb "black" lw 4 pt 7 ps 2
set style line 5 lt 5 lc rgb "black" lw 4
set style line 6 lt 6 lc rgb "brown" lw 4
#set label 1 "TSR 5" at graph .8, .9
plot "cfd/area_averaged_axial_mean_velocity_TI_1.txt" using 1:6 t "RANS, TI = 1%" ls 1 with lines,\
"park_model/wave_axial_velocity_tsr5_park_TI_1.txt" using 1:2 t "BEM-Park,TI=1%" ls 2 with lines,\
"cfd/area_averaged_axial_mean_velocity_TI_15.txt" using 1:6 t "RANS, TI = 15%" ls 3 with lines,\
"park_model/wave_axial_velocity_tsr5_park_TI_15.txt" using 1:2 t "BEM-Park,TI=15%" ls 4 with lines
example 2
important code
set key out horiz center top
#set terminal jpeg
#set output 'coeff_epp.jpg'
#set terminal png
#set output 'coeff_epp.png'
set terminal postscript eps font 24
set out 'coeff_naca0012.eps'
#set terminal X11
set autoscale
unset log
unset label
unset pm3d
set key out horiz center top
set xtic auto
set ytic auto
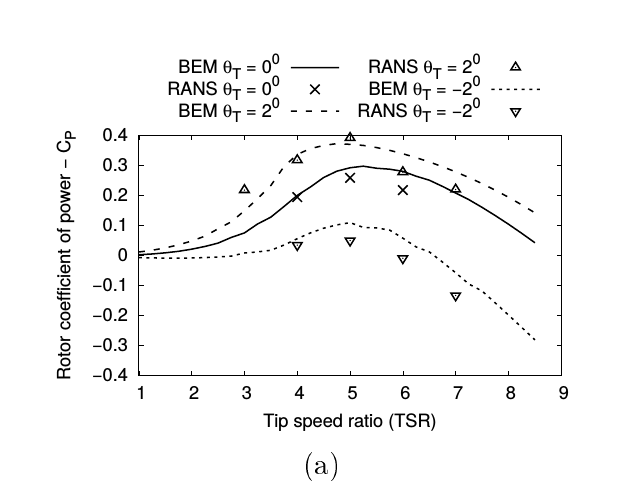
set xlabel "Tip speed ratio (TSR)"
set xrange [1:*]
# r0 initial pulse
set yrange [-0.4:0.4]
set ylabel "Rotor coefficient of power - C_P"
set style line 1 lt 1 lc rgb "black" lw 4 pointtype 2 pointsize 2
set style line 2 lt 2 lc rgb "black" lw 4 pointtype 7 pointsize 2
set style line 3 lt 3 lc rgb "black" lw 4 pointtype 6 pointsize 2
set style line 4 lt 4 lc rgb "black" lw 4 pointtype 8 pointsize 2
set style line 5 lt 5 lc rgb "black" lw 4 pointtype 10 pointsize 2
set style line 6 lt 6 lc rgb "brown" lw 4 pointtype 12 pointsize 2
set pointsize 2
set bars 3
plot "naca0012/re_135k/zero/coeff.plt" using 1:4 t "BEM {/Symbol q}_T = 0^{0}" ls 1 with lines ,\
"RANS/Cp_Ct_tsr_one_untwist.dat" using 1:2 t "RANS {/Symbol q}_T = 0^{0}" ls 1 with points ,\
"naca0012/re_135k/fwd_2/coeff.plt" using 1:4 t "BEM {/Symbol q}_T = 2^{0}" ls 2 with lines,\
"RANS/Cp_one_front_eldad_blade.dat" using 1:2 t "RANS {/Symbol q}_T = 2^{0}" ls 4 with points,\
"naca0012/re_135k/rear_2/coeff.plt" using 1:4 t "BEM {/Symbol q}_T = -2^{0}" ls 3 with lines,\
"RANS/Cp_Ct_tsr_one_rear.dat" using 1:2 t "RANS {/Symbol q}_T = -2^{0}" ls 5 with points

 浙公网安备 33010602011771号