Echarts 官网:http://echarts.apache.org/zh/index.html
安装依赖
npm安装
npm install echarts -S
或者用淘宝镜像安装
npm install -g cnpm --registry=https://registry.npm.taobao.org
cnpm install echarts -S
全局引入
在main.js中引入
import * as echarts from 'echarts';
Vue.prototype.$echarts = echarts
注意:一定要注意引入引入方式,否则会报错
若有报错可参照vue中使用echarts报错:“TypeError: Cannot read property ‘init‘ of undefined“报错原因及解决方案进行解决
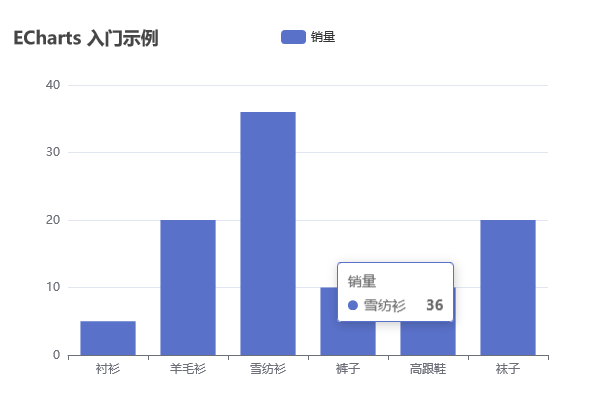
创建图表
此例是创建柱状图
<template>
  <div>
    <div id="main" style="width: 600px;height:400px;"></div>
  </div>
</template>

<script>
export default {
  name: 'index',
  data() {
    return {
    };
  },
  mounted() {
    this.myecharts()
  },
  methods: {
    myecharts(){
      var myChart = this.$echarts.init(document.getElementById('main'));
        // 指定图表的配置项和数据
        var option = {
            title: {
                text: 'ECharts 入门示例'
            },
            tooltip: {},
            legend: {
                data:['销量']
            },
            xAxis: {
                data: ["衬衫","羊毛衫","雪纺衫","裤子","高跟鞋","袜子"]
            },
            yAxis: {},
            series: [{
                name: '销量',
                type: 'bar',
                data: [5, 20, 36, 10, 10, 20]
            }]
        };
        // 使用刚指定的配置项和数据显示图表。
        myChart.setOption(option);
    }
  },
};
</script>