京东文胸数据分析
前段时间我们抓取了京东商城上面的文胸数据,共计80万条,今天我们就来进行一次简单地分析。为了方便交流,我将大致的数据清洗流程一并给出。
我们首先导入必要的库。
import pandas as pd
import numpy as np
import matplotlib.pyplot as plt
import seaborn as sns
%matplotlib inline
plt.rcParams['font.sans-serif'] = ['SimHei']
读取我们爬取到的数据,这次我们就以时间作为我们的索引,而不是默认的数字索引,事实上,一般来说,只要是我们的数据中带有时间字段,就会将时间作为我们的index索引。
df = pd.read_csv('jd_cup.csv',parse_dates=['creationTime'],index_col='creationTime')

df.info()

可以看到,我们的数据大致上是80万条。
df.head()

上面的表格中,分别是用户购物时候的客户端,用户购买的具体尺寸,商品的颜色和评价的内容。
最受女性喜爱的颜色分类。
我们首先来看一下颜色相关的内容,由于颜色信息各个商家标注存在不一致的情况,我们这里选取其中的颜色最多的10中颜色进行描述。
fig = plt.figure(figsize=(16,8))
ax = fig.add_subplot(121)

plt.title('最受女性欢迎的颜色Top10占比')
df.productColor.value_counts()[:10].plot.pie(cmap=plt.cm.rainbow, autopct='%.2f')
plt.ylabel('数量')
plt.xlabel('颜色')

ax2 = fig.add_subplot(122)
plt.title('最受女性欢迎的颜色Top10分布')
df.productColor.value_counts()[:10].plot.bar()

plt.show()

从以上两幅图可以看出,肤色和黑色遥遥领先,我们的数据总量是80万,这两种颜色数量已经超过了20万,占比超过1/4,因为数据里面的颜色分类难免包括一些类肤色和类黑色的数据,但是写法却千奇百怪,因此我并没有把这一类归属于肤色和黑色,所以,如果用更长的时间来进行数据的清洗的话,这两种颜色的数量会更多。也许,每个女生都会有这么两种颜色的文胸吧。
尺寸分布情况
我们首先将罩杯和尺寸进行分离
df.productSize = df.productSize.astype(str)

def size(x):
    if 'A' in x:
        return 'A'
    elif 'B' in x:
        return 'B'
    elif 'C' in x:
        return 'C'
    elif 'D' in x:
        return 'D'
    elif 'E' in x:
        return 'E'
    else:
        return None

df['size_A_E'] = df.productSize.apply(size)
df.head()

对罩杯进行描述性统计。
fig = plt.figure(figsize=(16,8))
ax1 = fig.add_subplot(121)

plt.title('Cup占比')
plt.xlabel('数量')
plt.ylabel('尺寸')
df.size_A_E.value_counts(ascending=True).plot.barh()

ax2 = fig.add_subplot(122)
df.size_A_E.value_counts(ascending=True).plot.pie(autopct='%.2f')
plt.show()

以上数据显示,B罩杯的女性占据绝对优势,达55.29%,A罩杯的女性紧随其后,两者之和接近80%。
下面再来总体的看一下尺寸情况。
罩杯的尺寸分为两种,分别是中国尺寸和国际尺寸,两者有一定的对应关系,比如国标尺寸的32对应于国际尺寸的70,所以有了这样的对应关系,我们可以使用函数将其统一化,方便我们后续的使用。
inter_size = ['70', '75', '80', '85', '90']     # 国际尺寸
china_size = ['32', '34', '36', '38', '40']    # 中国尺寸

cup_size = ['A', 'B', 'C', 'D', 'E']

def parse_cup_size(x):
    pool = []
    for i in inter_size:
        for j in cup_size:
            pool.append(i+j)

    for i in china_size:
        for j in cup_size:
            pool.append(i+j)

    for size in pool:
        if size in x:
            return size
    return None


# 先替换国际尺寸
df['parse_cup_size'] = df.productSize.apply(parse_cup_size)

# 进行国际和大陆的尺寸统一,统一为国际尺寸
df.parse_cup_size.fillna('忽略', inplace=True)
df.parse_cup_size.astype(str)

import re

def re_(x):
    x = re.sub('32', '70', x)
    x = re.sub('34', '75', x)
    x = re.sub('36', '80', x)
    x = re.sub('38', '85', x)
    x = re.sub('40', '90', x)
    return x

df['cup_result'] =  df.parse_cup_size.apply(re_)
这样的话,我们就将两种不同的尺寸规整化为一种尺寸了,上述的cup_result字段使我们最终需要的字段。
下面对这以整体进行统计。
parse_cup = df.cup_result.value_counts(ascending=False)
parse_cup.name = ''
del parse_cup['忽略']

fig = plt.figure(figsize=(16,8))
ax = fig.add_subplot(121)

plt.title('具体尺寸占比')
plt.xlabel('size')
plt.ylabel('number')
parse_cup[:10].plot.bar()

ax2 = fig.add_subplot(122)
parse_cup[:10].plot.pie(autopct='%.2f')

plt.show()

就具体尺寸而言,75B这一款占比超过30%。
客户端占比情况
为了对客户端情况进行分析,我们首先对数据进行预处理,将多余的字符去除。
df['userClientShow'] = df['userClientShow'].fillna('未知')
# 定义替换函数,pandas默认的replace方法只能完全匹配
def my_replace(x):
    x = x.replace('来自', '').replace('京东', '')
    return x
df.userClientShow = df.userClientShow.apply(my_replace)

cli = df.userClientShow.replace('未知', None)

plt.figure(figsize=(10,10))
clients = df.userClientShow.value_counts(ascending=False)
type(clients)
del clients['未知']
clients.name = ''

plt.title('京东购物客户端占比')
clients.plot.pie(autopct='%.2f')
plt.show()

以安卓和ios数量最多,这个倒是意料之中,微信的总体占比也是客观的,毕竟腾讯也是京东的第一大股东。
用户等级分布
df.userLevelName.value_counts(ascending=False)
plt.figure(figsize=(15,8))
plt.title('京东用户等级分布情况')
plt.xlabel('等级')
plt.ylabel('数量')
df.userLevelName.value_counts(ascending=False).plot.bar()# color='#333F2D'
plt.savefig('等级.jpg')
plt.show()

时间的分布情况
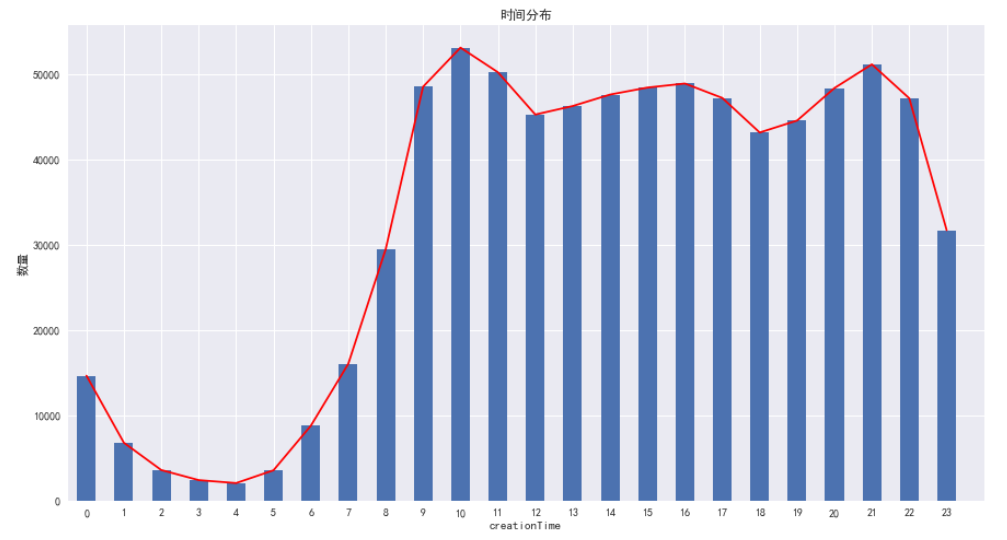
之前我们提到,如果索引中带有时间字段,那么一般会将索引设置为时间,事实上,时间是一个非常重要的数据,我们将日期作为索引,并不是忽略他的意义,而是为嘞更好的进行分析。
我们可以通过时间看出用户购买商品的一个整体分布。
df['label'] = 1
group_ = df.groupby(df.index.hour)

time_ = group_['label'].sum()

plt.figure(figsize=(15,8))
plt.subplot(111)
plt.title('时间分布')
plt.xlabel('时间')
plt.ylabel('数量')
time_.plot.bar()

time_.plot(xlim = [-0.5,24 ], color='r')

plt.savefig('时间.jpg')
plt.show()

从以上的图标可以看出,用户在购买文胸时,峰值出现在上午的10点和晚上的9点,至于原因么,上午的时间点,可能是在等着下班,而晚上---
评论的词云信息
df.content = df.content.astype(str)

# 对评论进行词频统计
import jieba
from wordcloud import WordCloud
import PIL

raw_text = ' '.join(list(df.content))
result = []

def parse():
    for word in jieba.cut(raw_text):
        if len(word) > 1:
            result.append(word)


def wordcloudplot(data, file_name):
    path = 'msyh.ttf'
    alice_mask = np.array(PIL.Image.open('yuan.jpg'))
    wordcloud = WordCloud(font_path=path,
                          background_color="white",
                          margin=5,
                          width=1000, height=800,
                          mask=alice_mask, max_words=1000, max_font_size=100,
                          random_state=42)
    wordcloud = wordcloud.generate(data)

    wordcloud.to_file(file_name)
    plt.imshow(wordcloud)
    plt.axis("off")
    plt.show()

parse()
text = ' '.join(result)
wordcloudplot(text, 'wordcloud.jpg')


 浙公网安备 33010602011771号