
dotnet 线上异常分析工具
现在.NET Core 上线后,不可避免的会出现各种问题,如内存泄漏、CPU占用高、接口处理耗时较长等问题。这个时候就需要快速准确的定位问题,并解决。
这时候就可以使用.NET Core 为开发人员提供了一系列功能强大的诊断工具。
接下来就详细了解下:.NET Core 全局诊断工具
- dotnet-counters
- dotnet-dump
- dotnet-gcdump
- dotnet-trace
- dotnet-symbol
- dotnet-sos
1、dotnet-counters
简介
dotnet-counters 是一个性能监视工具,用于初级运行状况监视和性能调查。它通过 EventCounter API 观察已发布的性能计数器值。例如,可以快速监视CUP使用情况或.NET Core 应用程序中的异常率等指标
安装
通过nuget包安装:
dotnet tool install --global dotnet-counters主要命令
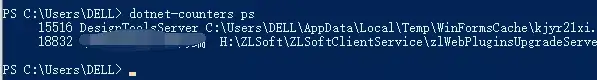
- dotnet-counters ps
- dotnet-counters list
- dotnet-counters collect
- dotnet-counters monitor
a)dotnet-counters ps:显示可监视的 dotnet 进程的列表
b)dotnet-counters list命令:显示按提供程序分组的计数器名称和说明的列表
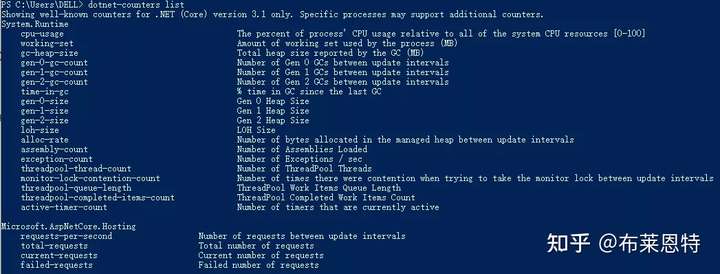
包括:运行时和Web主机运行信息
c)dotnet-counters collect 命令:定期收集所选计数器的值,并将它们导出为指定的文件格式
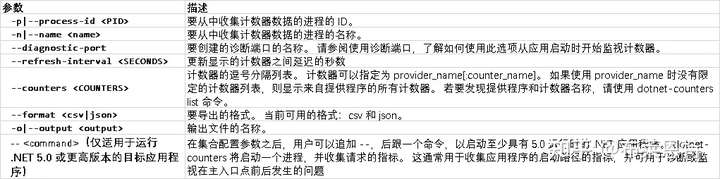
dotnet-counters collect [-h|--help] [-p|--process-id] [-n|--name] [--diagnostic-port] [--refresh-interval] [--counters <COUNTERS>] [--format] [-o|--output] [-- <command>]参数说明:
示例:收集dotnet core 服务端所有性能计数器值,间隔时间为3s

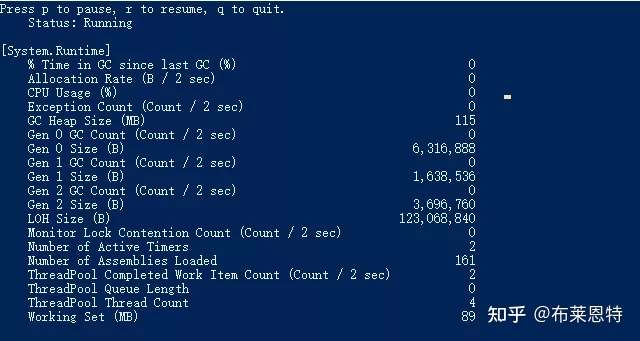
d)dotnet-counters monitor命令:显示所选计数器的定期刷新值
dotnet-counters monitor [-h|--help] [-p|--process-id] [-n|--name] [--diagnostic-port] [--refresh-interval] [--counters] [-- <command>]示例:dotnet-counters monitor --process-id 18832 --refresh-interval 2
2、dotnet-dump
简介
通过 dotnet-dump 工具,可在不使用本机调试器的情况下收集和分析 Windows 和 Linux 核心转储。
安装
dotnet tool install --global dotnet-dump命令
- dotnet-dump collect
- dotnet-dump analyze
a) dotnet-dump collect:从进程生成dump
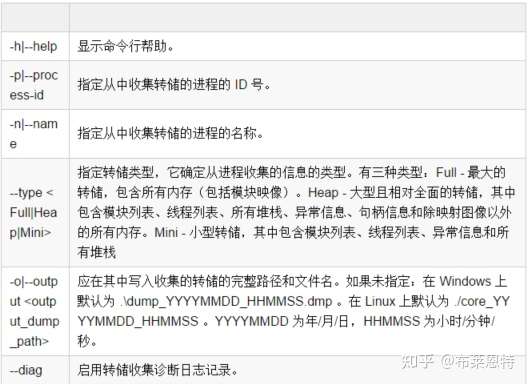
dotnet-dump collect [-h|--help] [-p|--process-id] [-n|--name] [--type] [-o|--output] [--diag]参数说明:
示例
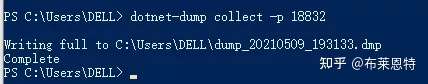
dotnet-dump collect -p 18832
b)dotnet-dump analyze:启动交互式 shell 以了解转储
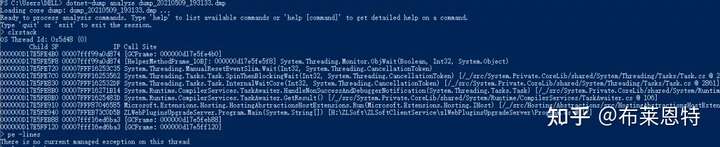
dotnet-dump analyze <dump_path> [-h|--help] [-c|--command]示例:dotnet-dump analyze dump_20210509_193133.dmp 进入dmp分析,查看堆栈和未处理异常
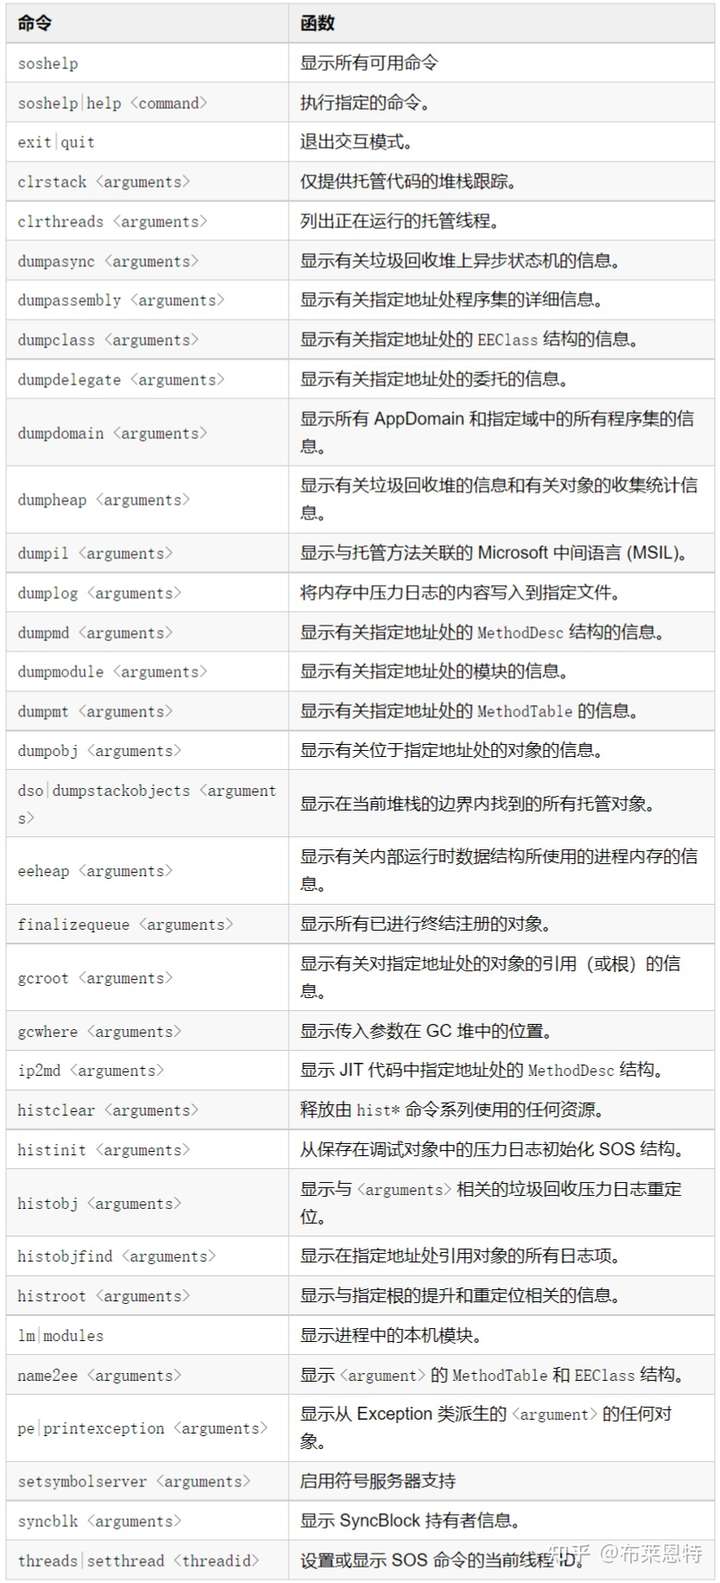
Sos命令列表:
3、dotnet-gcdump
简介
dotnet-gcdump 工具可用于为活动 .NET 进程收集 GC(垃圾回收器)转储。
dotnet-gcdump 全局工具使用 EventPipe 收集实时 .NET 进程的 GC(垃圾回收器)转储。创建 GC 转储时需要在目标进程中触发 GC、开启特殊事件并从事件流中重新生成对象根图。此过程允许在进程运行时以最小的开销收集 GC 转储。
这些转储对于以下几种情况非常有用:
- 比较多个时间点堆上的对象数。
- 分析对象的根(回答诸如“还有哪些引用此类型的内容?”等问题)。
- 收集有关堆上的对象计数的常规统计信息。
安装:
dotnet tool install --global dotnet-gcdump示例:从当前正在运行的进程中收集 GC 转储
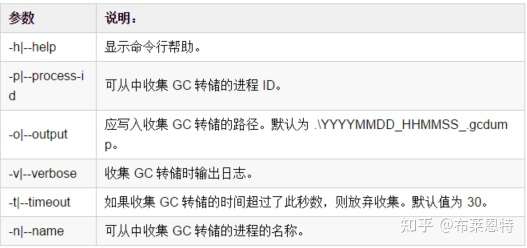
dotnet-gcdump collect [-h|--help] [-p|--process-id <pid>] [-o|--output <gcdump-file-path>] [-v|--verbose] [-t|--timeout <timeout>] [-n|--name <name>]参数说明:
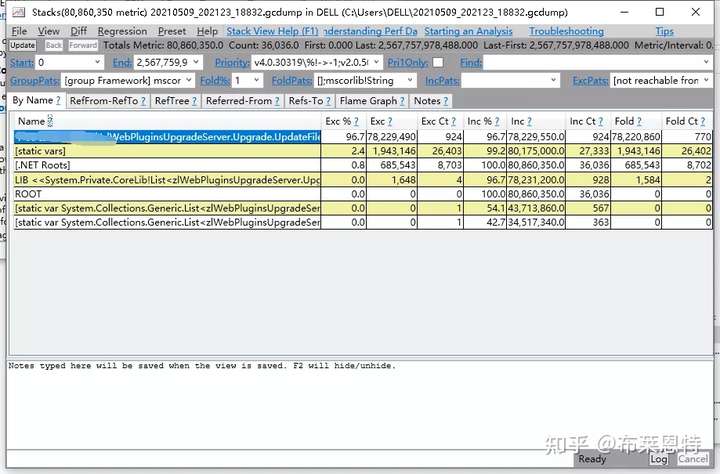
生成示例:dotnet-gcdump collect -p 18832

查看生成文件:使用perfview查看:
4、dotnet-trace
简介
分析数据通过 .NET Core 中的 EventPipe 公开。通过 dotnet-trace 工具,可以使用来自应用的有意思的分析数据,这些数据可帮助你分析应用运行缓慢的根本原因。
安装
dotnet tool install --global dotnet-trace命令
dotnet-trace [-h, --help] [--version] <command>常用命令
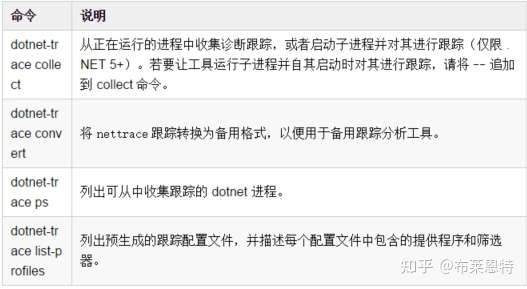
示例
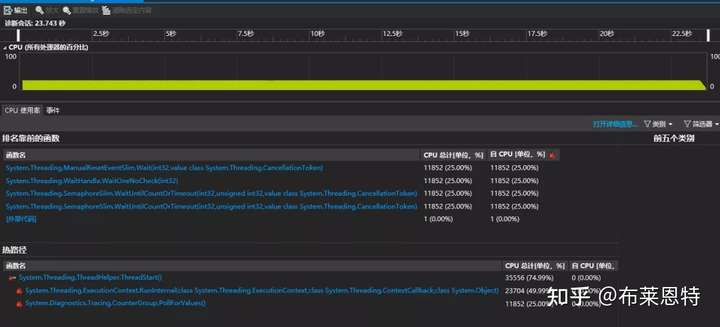
收集进程18832诊断跟踪:
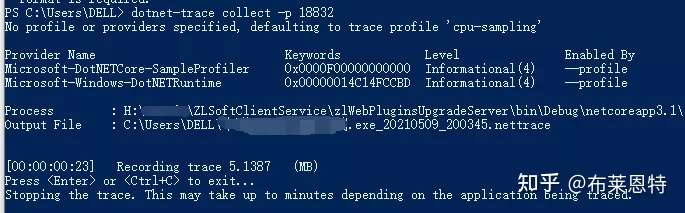
使用Vs打开生成的跟踪文件如下:
5、dotnet-symbol
简介
dotnet-symbol 用于下载打开核心转储或小型转储所需的文件(符号、DAC/DBI、主机文件等)。如果需要使用符号和模块来调试在其他计算机上捕获的转储文件,请使用此工具。
安装
dotnet tool install --global dotnet-symbol
命令
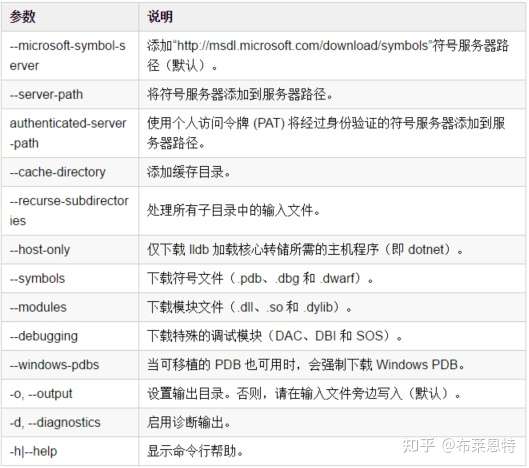
dotnet-symbol [-h|--help] [options] <FILES>
options
6、dotnet-sos
简介
dotnet-sos 在 Linux 和 macOS(如果使用的是 Windbg/cdb,则在 Windows 上)安装 SOS调试扩展。
安装
dotnet tool install --global dotnet-sos命令
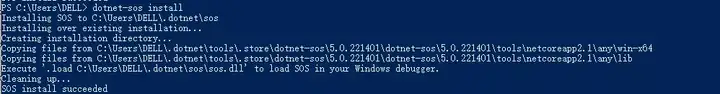
在本地安装用于调试 .NET Core 进程的 SOS 扩展
dotnet-sos install示例
总结
微软提供了一套强大的诊断工具,熟练的使用这些工具,可以更快更有效的发现程序的运行问题,解决程序的性能问题。
过程中主要使用:counters、dump、trace 工具用于分析.NET Core性能问题。
最近又了解到微软已对这些基础工具已封装了对应包(Microsoft.Diagnostics.NETCore.Client),可以用来开发出自己的有界面的诊断工具。后续将了解实现一个。
转自:chaney1992 链接:http://cnblogs.com/cwsheng/p/14748477.html


【推荐】编程新体验,更懂你的AI,立即体验豆包MarsCode编程助手
【推荐】凌霞软件回馈社区,博客园 & 1Panel & Halo 联合会员上线
【推荐】抖音旗下AI助手豆包,你的智能百科全书,全免费不限次数
【推荐】博客园社区专享云产品让利特惠,阿里云新客6.5折上折
【推荐】轻量又高性能的 SSH 工具 IShell:AI 加持,快人一步
· 一个费力不讨好的项目,让我损失了近一半的绩效!
· 清华大学推出第四讲使用 DeepSeek + DeepResearch 让科研像聊天一样简单!
· 实操Deepseek接入个人知识库
· CSnakes vs Python.NET:高效嵌入与灵活互通的跨语言方案对比
· Plotly.NET 一个为 .NET 打造的强大开源交互式图表库