用Tensorflow实现多层神经网络
用Tensorflow实现简单多层神经网络
觉得有用的话,欢迎一起讨论相互学习~
参考文献
Tensorflow机器学习实战指南
源代码见下方链接
数据集及网络结构
数据集
- 使用预测出生体重的数据集csv格式,其中数据的第2列至第8列为训练属性,第9列为体重数据即标签,第一列为标记是否为低出生体重的标记,本博文中不对其进行讨论。
Low Birthrate data:
Columns(列)   Variable(值)                             Abbreviation
-----------------------------------------------------------------------------
Low Birth Weight (0 = Birth Weight >= 2500g,            LOW
                         1 = Birth Weight < 2500g)
低出生体重
Age of the Mother in Years                              AGE
母亲妊娠年龄
Weight in Pounds at the Last Menstrual Period           LWT
在最后一次月经期间体重增加。
Race (1 = White, 2 = Black, 3 = Other)                  RACE
肤色
Smoking Status During Pregnancy (1 = Yes, 0 = No)       SMOKE
怀孕期间吸烟状态
History of Premature Labor (0 = None  1 = One, etc.)    PTL
早产的历史
History of Hypertension (1 = Yes, 0 = No)               HT
高血压历史
Presence of Uterine Irritability (1 = Yes, 0 = No)      UI
子宫刺激性的存在
Birth Weight in Grams                                   BWT
以克为单位的体重
网络结构
- 所使用网络结构十分简单为三层隐层网络分别为25-10-3 的结构。其中loss 函数为L1损失范数,激活函数为ReLU.
少说废话多写代码
数据读取
import tensorflow as tf
import matplotlib.pyplot as plt
import csv
import os
import numpy as np
import requests
from tensorflow.python.framework import ops

# name of data file
# 数据集名称
birth_weight_file = 'birth_weight.csv'

# download data and create data file if file does not exist in current directory
# 如果当前文件夹下没有birth_weight.csv数据集则下载dat文件并生成csv文件
if not os.path.exists(birth_weight_file):
    birthdata_url = 'https://github.com/nfmcclure/tensorflow_cookbook/raw/master/01_Introduction/07_Working_with_Data_Sources/birthweight_data/birthweight.dat'
    birth_file = requests.get(birthdata_url)
    birth_data = birth_file.text.split('\r\n')
    # split分割函数,以一行作为分割函数,windows中换行符号为'\r\n',每一行后面都有一个'\r\n'符号。
    birth_header = birth_data[0].split('\t')
    # 每一列的标题,标在第一行,即是birth_data的第一个数据。并使用制表符作为划分。
    birth_data = [[float(x) for x in y.split('\t') if len(x) >= 1] for y in birth_data[1:] if len(y) >= 1]
    # 数组第一维表示遍历行从第一行开始,所以不包含标题,数组第二维遍历列(使用制表符进行分割)
    # print(np.array(birth_data).shape)
    # (189, 9)不包含标题
    # 此为list数据形式不是numpy数组不能使用np,shape函数,但是我们可以使用np.array函数将list对象转化为numpy数组后使用shape属性进行查看。
    # 注意,向其中写入文件时一定要去掉换行等操作符号,如果在csv中有换行符,也会作为一行数据的。
    # 读文件时,我们把csv文件读入列表中,写文件时会把列表中的元素写入到csv文件中。
    #
    # list = ['1', '2', '3', '4']
    # out = open(outfile, 'w')
    # csv_writer = csv.writer(out)
    # csv_writer.writerow(list)
    # 可能遇到的问题:直接使用这种写法会导致文件每一行后面会多一个空行。
    #
    # 解决办法如下:
    #
    # out = open(outfile, 'w', newline='')  注意newline属性
    # csv_writer = csv.writer(out, dialect='excel')
    # csv_writer.writerow(list)

    with open(birth_weight_file, "w", newline='') as f:
        # 创建当前目录下birth_weight.csv文件
        writer = csv.writer(f)
        writer.writerows([birth_header])
        writer.writerows(birth_data)
        f.close()

# 将出生体重数据读进内存
birth_data = []
with open(birth_weight_file, newline='') as csvfile:
    csv_reader = csv.reader(csvfile)  # 使用csv.reader读取csvfile中的文件
    birth_header = next(csv_reader)  # 读取第一行每一列的标题
    for row in csv_reader:  # 将csv 文件中的数据保存到birth_data中
        birth_data.append(row)

birth_data = [[float(x) for x in row] for row in birth_data]  # 将数据转换为float格式

# 对于每组数据而言,第8列(序号从0开始)即为标签序列-体重
y_vals = np.array([x[8] for x in birth_data])

# 特征序列
cols_of_interest = ['AGE', 'LWT', 'RACE', 'SMOKE', 'PTL', 'HT', 'UI']
x_vals = np.array(
    [[x[ix] for ix, feature in enumerate(birth_header) if feature in cols_of_interest] for x in birth_data])
# 数组一维使用for x in birth_data遍历整个数组
# enumerate(birth_header)函数返回ix索引和feature特征,用读取的feature和cols_of_interest进行匹配
# 使x[ix]数据存入数组中
数据预处理
# 重置Tensorflow图模型
ops.reset_default_graph()

# Create graph session
sess = tf.Session()

# set batch size for training
batch_size = 100

# make results reproducible
seed = 3
np.random.seed(seed)
tf.set_random_seed(seed)

# 将所有数据分割成训练集80%测试集20%
train_indices = np.random.choice(len(x_vals), round(len(x_vals)*0.8), replace=False)
# np.random.choice(a,n,p)可以传入一个一维数组a或者一个int值a,如果是一维数组a将可以设定几率P返回数组中的n个值。
# 如果是int值a,则返回一个随机生成0~(a-1)之间的n个数的数组。利用该数组可以作为数据的索引值来选定数据集中一定比例的样本。
'''
 Examples
            Generate a uniform random sample from np.arange(5) of size 3:
            >>> np.random.choice(5, 3)
            array([0, 3, 4])
            >>> #This is equivalent to np.random.randint(0,5,3)

            Generate a non-uniform random sample from np.arange(5) of size 3:
            >>> aa_milne_arr = ['pooh', 'rabbit', 'piglet', 'Christopher']
            >>> np.random.choice(aa_milne_arr, 5, p=[0.5, 0.1, 0.1, 0.3])
            array(['pooh', 'pooh', 'pooh', 'Christopher', 'piglet'],
                  dtype='|S11')
'''
test_indices = np.array(list(set(range(len(x_vals))) - set(train_indices)))
'''example
------------------------------
a = range(8)
print('a:', a)
b = set(a)
print('b=set(a):', b)
a1 = np.array([1, 4, 6])
print('a1=np.array:', a1)
b1 = set(a1)
print('b1=set(a1):', b1)
c = list(b - b1)
print('list(b-b1)', c)
# a: range(0, 8)
# b=set(a): {0, 1, 2, 3, 4, 5, 6, 7}
# a1=np.array: [1 4 6]
# b1=set(a1): {1, 4, 6}
# list(b-b1) [0, 2, 3, 5, 7]

'''
x_vals_train = x_vals[train_indices]
x_vals_test = x_vals[test_indices]
y_vals_train = y_vals[train_indices]
y_vals_test = y_vals[test_indices]


# 标准化操作,将数据标准化到0~1的区间
def normalize_cols(m):
    col_max = m.max(axis=0)
    col_min = m.min(axis=0)
    return (m - col_min)/(col_max - col_min)


x_vals_train = np.nan_to_num(normalize_cols(x_vals_train))
x_vals_test = np.nan_to_num(normalize_cols(x_vals_test))


# 解决NaN无法处理的问题,如果是很大的(正/负)数用一个很大的(正/负)实数代替,如果是很小的数用0代替
构建神经网络模型
# 定义变量函数(权重和偏差),stdev参数表示方差
def init_weight(shape, st_dev):
    weight = tf.Variable(tf.random_normal(shape, stddev=st_dev))
    return (weight)


def init_bias(shape, st_dev):
    bias = tf.Variable(tf.random_normal(shape, stddev=st_dev))
    return (bias)


# 创建数据占位符
x_data = tf.placeholder(shape=[None, 7], dtype=tf.float32)
y_target = tf.placeholder(shape=[None, 1], dtype=tf.float32)


# 创建一个全连接层函数
def fully_connected(input_layer, weights, biases):
    layer = tf.add(tf.matmul(input_layer, weights), biases)
    return (tf.nn.relu(layer))


# --------Create the first layer (25 hidden nodes)--------
weight_1 = init_weight(shape=[7, 25], st_dev=10.0)
bias_1 = init_bias(shape=[25], st_dev=10.0)
layer_1 = fully_connected(x_data, weight_1, bias_1)

# --------Create second layer (10 hidden nodes)--------
weight_2 = init_weight(shape=[25, 10], st_dev=10.0)
bias_2 = init_bias(shape=[10], st_dev=10.0)
layer_2 = fully_connected(layer_1, weight_2, bias_2)

# --------Create third layer (3 hidden nodes)--------
weight_3 = init_weight(shape=[10, 3], st_dev=10.0)
bias_3 = init_bias(shape=[3], st_dev=10.0)
layer_3 = fully_connected(layer_2, weight_3, bias_3)

# --------Create output layer (1 output value)--------
weight_4 = init_weight(shape=[3, 1], st_dev=10.0)
bias_4 = init_bias(shape=[1], st_dev=10.0)
final_output = fully_connected(layer_3, weight_4, bias_4)

# 绝对值L1损失范数
loss = tf.reduce_mean(tf.abs(y_target - final_output))

# 定义优化器
my_opt = tf.train.AdamOptimizer(0.01)  # 使用Adam优化器,学习率使用0.01
train_step = my_opt.minimize(loss)
填充数据与训练
# Initialize Variables
init = tf.global_variables_initializer()
sess.run(init)

# 训练
loss_vec = []
test_loss = []
for i in range(2000):
    rand_index = np.random.choice(len(x_vals_train), size=batch_size)
    rand_x = x_vals_train[rand_index]  # shape=[batch_size,7]
    rand_y = y_vals_train[rand_index].reshape([batch_size, 1])
    # 使用训练数据对网络进行训练
    sess.run(train_step, feed_dict={x_data: rand_x, y_target: rand_y})

    temp_loss = sess.run(loss, feed_dict={x_data: rand_x, y_target: rand_y})
    loss_vec.append(temp_loss)  # 将训练集上的误差存进loss_vec中

    test_temp_loss = sess.run(loss, feed_dict={x_data: x_vals_test, y_target: np.transpose([y_vals_test])})
    test_loss.append(test_temp_loss)  # 将测试集上的误差存进test_loss中
    if (i + 1)%200 == 0:
        print('Generation: ' + str(i + 1) + '. Loss = ' + str(temp_loss))


# 结果展示
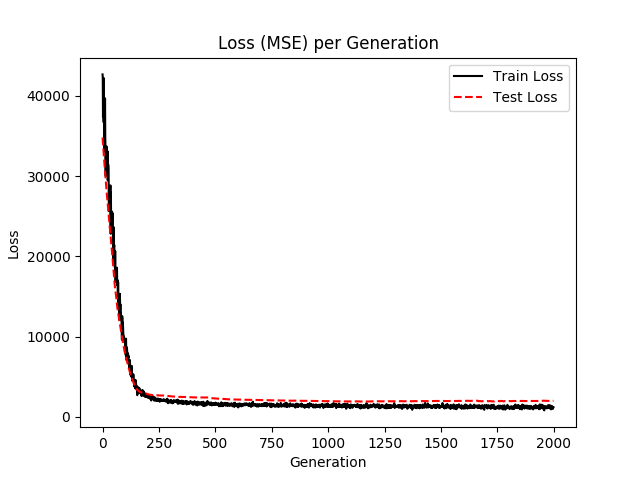
Generation: 200. Loss = 2763.73
Generation: 400. Loss = 1717.1
Generation: 600. Loss = 1218.89
Generation: 800. Loss = 1493.56
Generation: 1000. Loss = 1634.2
Generation: 1200. Loss = 1392.12
Generation: 1400. Loss = 1388.24
Generation: 1600. Loss = 1055.66
Generation: 1800. Loss = 1105.95
Generation: 2000. Loss = 1205.54
使用matplotlib绘制loss值
# 使用matplotlib显示loss
plt.plot(loss_vec, 'k-', label='Train Loss')
plt.plot(test_loss, 'r--', label='Test Loss')
plt.title('Loss (MSE) per Generation')
plt.legend(loc='upper right')
plt.xlabel('Generation')
plt.ylabel('Loss')
plt.show()

升级版本
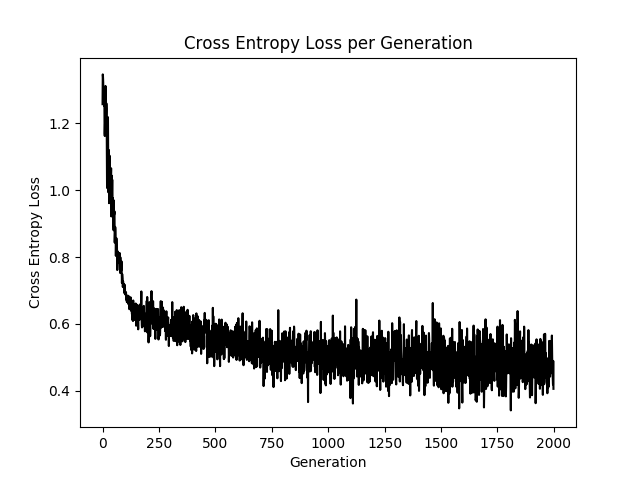
使用sigmoid激活函数交叉熵函数作为Cost Function
- 只需做如下修改
# activation 标志位Ture则使用非线性函数sigmoid,否则使用线性函数方式
def logistic(input_layer, multiplication_weight, bias_weight, activation=True):
    linear_layer = tf.add(tf.matmul(input_layer, multiplication_weight), bias_weight)
    if activation:
        return (tf.nn.sigmoid(linear_layer))
    else:
        return (linear_layer)

# 交叉熵函数
loss = tf.reduce_mean(tf.nn.sigmoid_cross_entropy_with_logits(logits=final_output, labels=y_target))


 浙公网安备 33010602011771号