【openpyxl模块】
from django.http import HttpResponse
from django.shortcuts import render
import openpyxl


def test1(request):
    """ 读取excel表格 """
    file_path = 'excel_file/测试数据-表格.xlsx'

    # load_workbook中的参数,可以为路径,可以为文件对象
    workbook = openpyxl.load_workbook(file_path) 		 # <openpyxl.workbook.workbook.Workbook object>

    # 表对象(单表) # <Worksheet "Sheet1">
    sheet = workbook.active

    # 打印单表每一行
    for row in sheet.iter_rows(values_only=True):
        num, name, class_s = row
        print(num, name, class_s)

        # 1.row对象       for row in sheet.iter_rows()
        # (< Cell 'Sheet1'.A1 >, < Cell 'Sheet1'.B1 >, < Cell 'Sheet1'.C1 >)
        # (< Cell 'Sheet1'.A2 >, < Cell 'Sheet1'.B2 >, < Cell 'Sheet1'.C2 >)
        # (< Cell 'Sheet1'.A3 >, < Cell 'Sheet1'.B3 >, < Cell 'Sheet1'.C3 >)
        # (< Cell 'Sheet1'.A4 >, < Cell 'Sheet1'.B4 >, < Cell 'Sheet1'.C4 >)
        # (< Cell 'Sheet1'.A5 >, < Cell 'Sheet1'.B5 >, < Cell 'Sheet1'.C5 >)

        # 2.values_only=True:仅返回单元格中的值
        # ('学号', '姓名', '班级')
        # (1, '张三', '计222')
        # (2, '李四', '计222')
        # (3, '王五', '计222')
        # (4, '赵六', '计222')

        # 3.解包;num, name, class_s = row
        # 学号 姓名 班级
        # 1 张三 计222
        # 2 李四 计222
        # 3 王五 计222
        # 4 赵六 计222

    return HttpResponse('ok')


def test2(request):
    """ 生成excel表格,并保存至指定路径 """

    # 生成工作薄:工作簿是一个 Excel 文件,可以包含多个工作表。它是整个文件的容器。
    workbook = openpyxl.Workbook()

    # 工作表:工作表是工作簿中的单个页面或表格
    sheet = workbook.active

    # 设置工作表名称
    sheet.title = "学生表"

    # 添加表头
    headers = ['学号', '姓名', '班级']
    sheet.append(headers)

    # 添加用户数据
    users = [
        ('1', '张三', '计222'),
        ('2', '李四', '计222'),
        ('3', '王五', '计222'),
    ]
    for row in users:
        sheet.append(row)

    # 保存
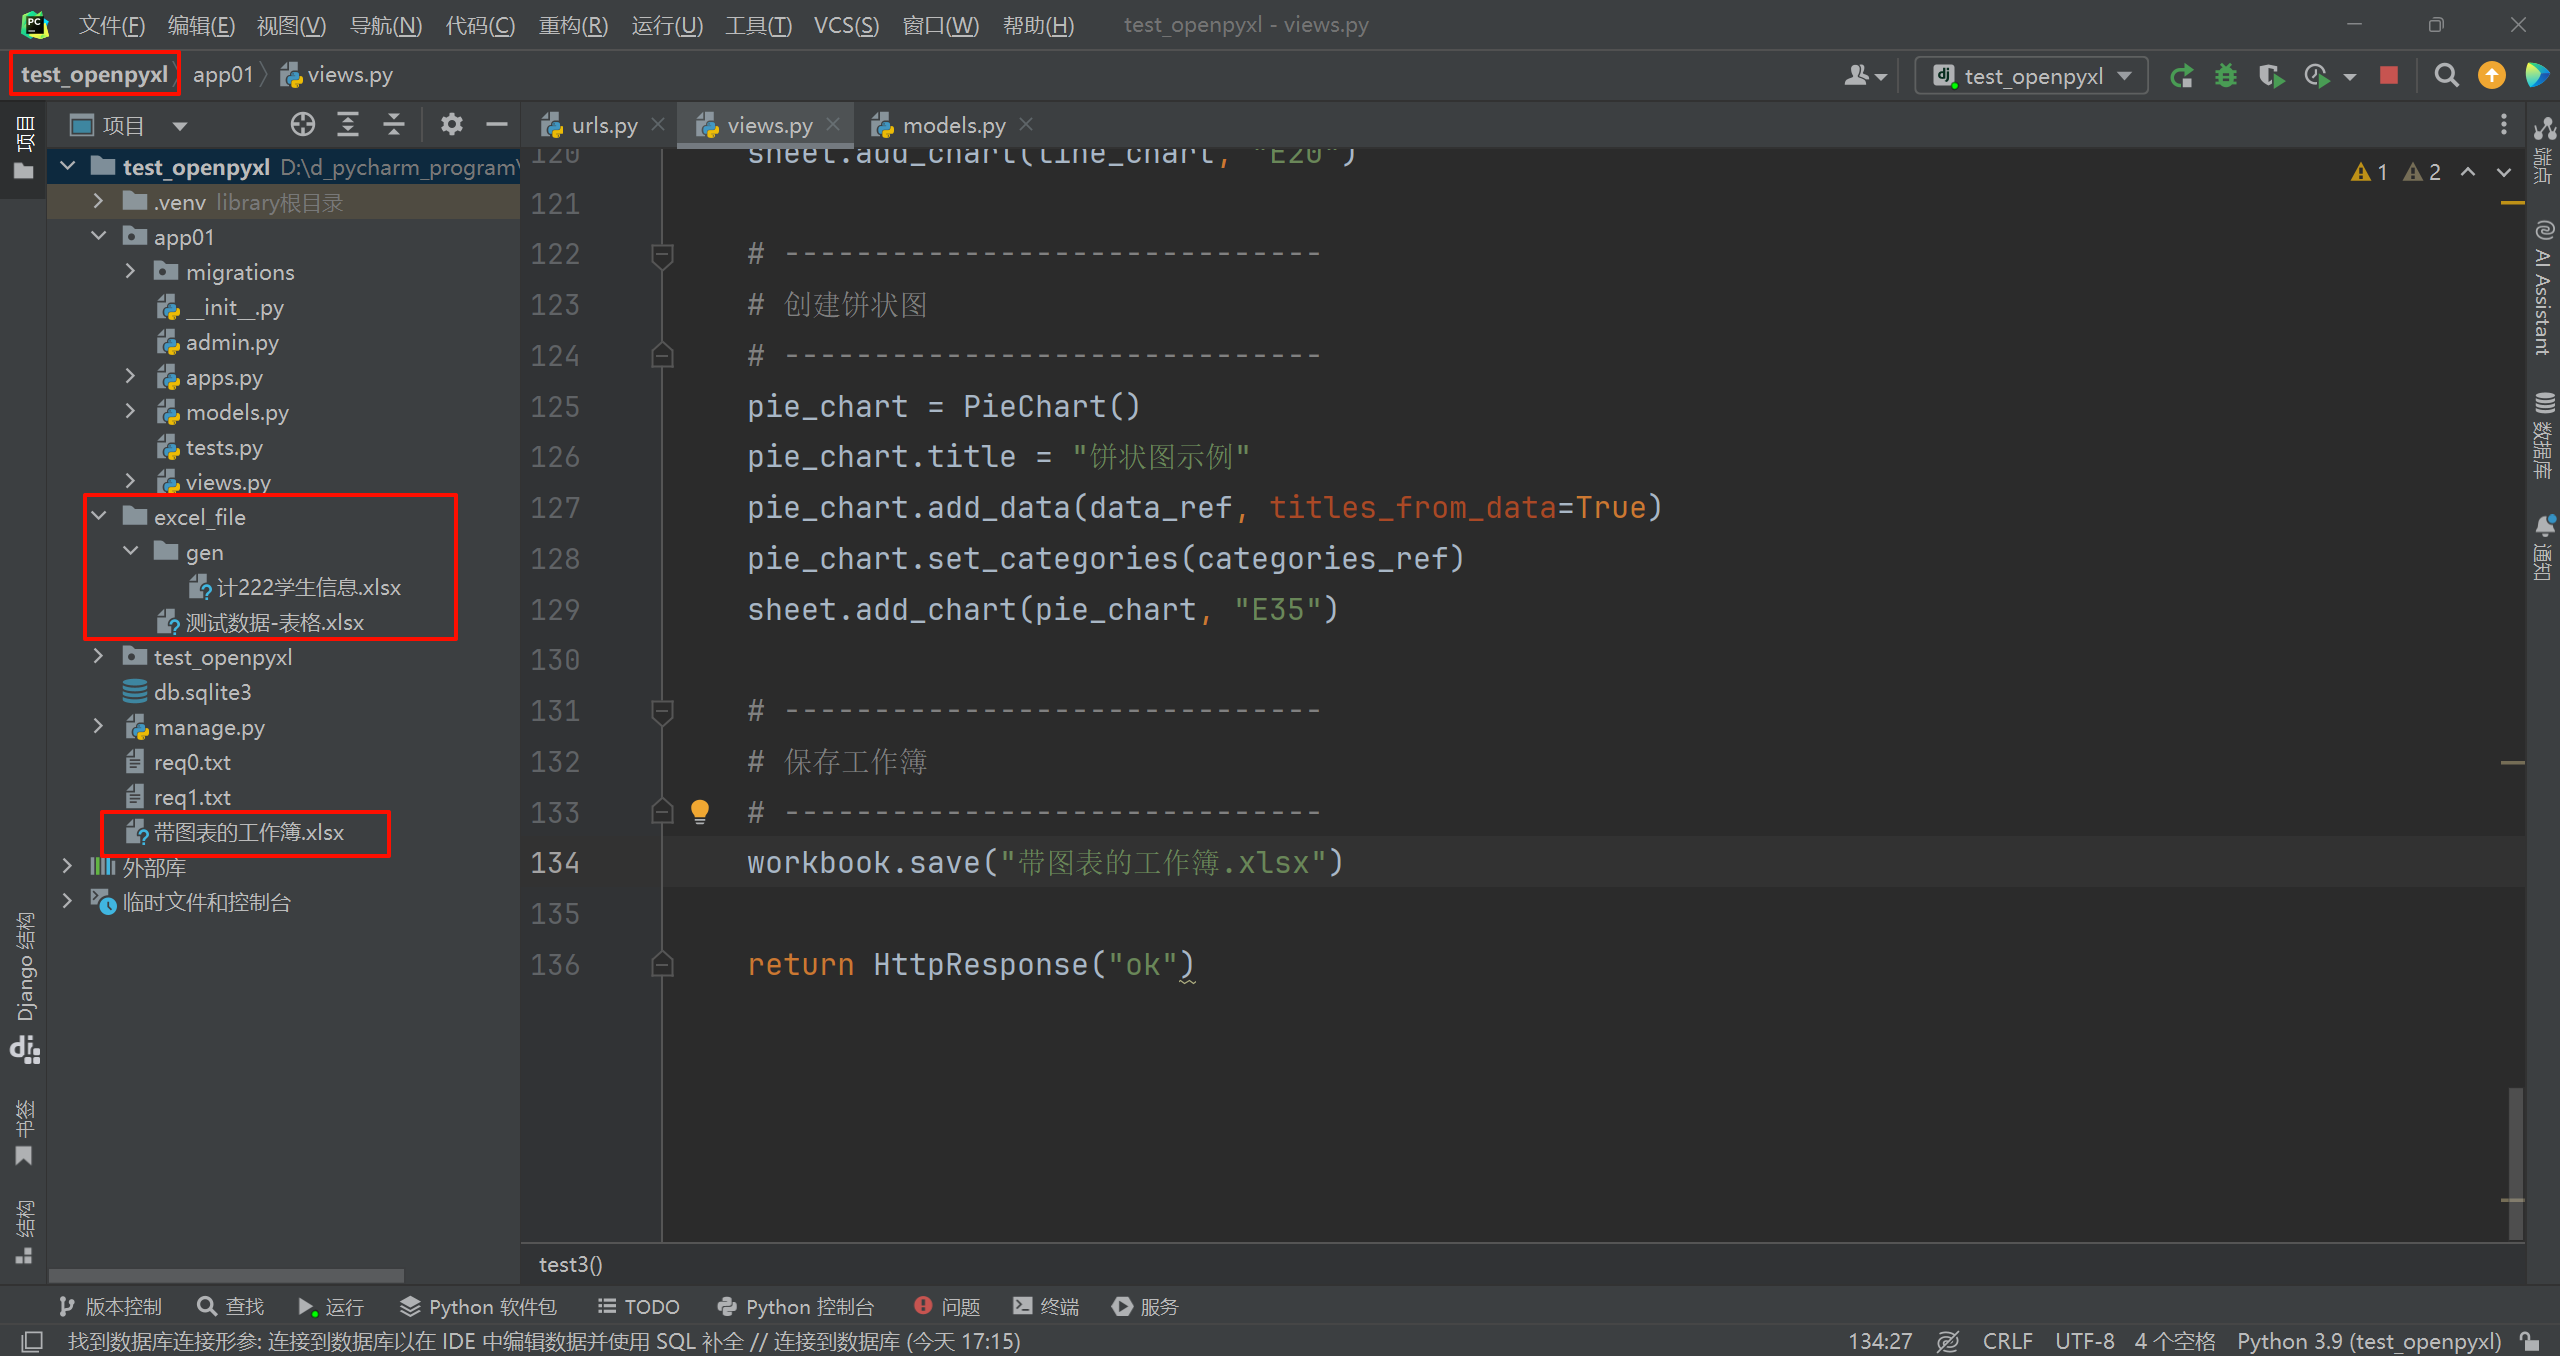
    save_path = "excel_file/gen/计222学生信息.xlsx"
    workbook.save(save_path)

    return HttpResponse('ok')

def test3(request):
    """ 生产图表 """
    from openpyxl import Workbook
    from openpyxl.chart import BarChart, LineChart, PieChart, Reference

    # 创建新的工作簿和工作表
    workbook = Workbook()
    sheet = workbook.active

    # 填充数据
    data = [
        ["项目", "值"],
        ["A", 10],
        ["B", 20],
        ["C", 30],
        ["D", 40],
    ]

    for row in data:
        sheet.append(row)

    # 创建数据范围的引用对象
    data_ref = Reference(sheet, min_col=2, min_row=2, max_col=2, max_row=5)
    categories_ref = Reference(sheet, min_col=1, min_row=2, max_row=5)

    # ------------------------------
    # 创建柱状图
    # ------------------------------
    bar_chart = BarChart()
    bar_chart.title = "柱状图示例"
    bar_chart.x_axis.title = "项目"
    bar_chart.y_axis.title = "值"
    bar_chart.add_data(data_ref, titles_from_data=True)
    bar_chart.set_categories(categories_ref)
    sheet.add_chart(bar_chart, "E1")

    # ------------------------------
    # 创建折线图
    # ------------------------------
    line_chart = LineChart()
    line_chart.title = "折线图示例"
    line_chart.x_axis.title = "项目"
    line_chart.y_axis.title = "值"
    line_chart.add_data(data_ref, titles_from_data=True)
    line_chart.set_categories(categories_ref)
    sheet.add_chart(line_chart, "E20")

    # ------------------------------
    # 创建饼状图
    # ------------------------------
    pie_chart = PieChart()
    pie_chart.title = "饼状图示例"
    pie_chart.add_data(data_ref, titles_from_data=True)
    pie_chart.set_categories(categories_ref)
    sheet.add_chart(pie_chart, "E35")

    # ------------------------------
    # 保存工作簿
    # ------------------------------
    workbook.save("带图表的工作簿2.xlsx")

    return HttpResponse("ok")

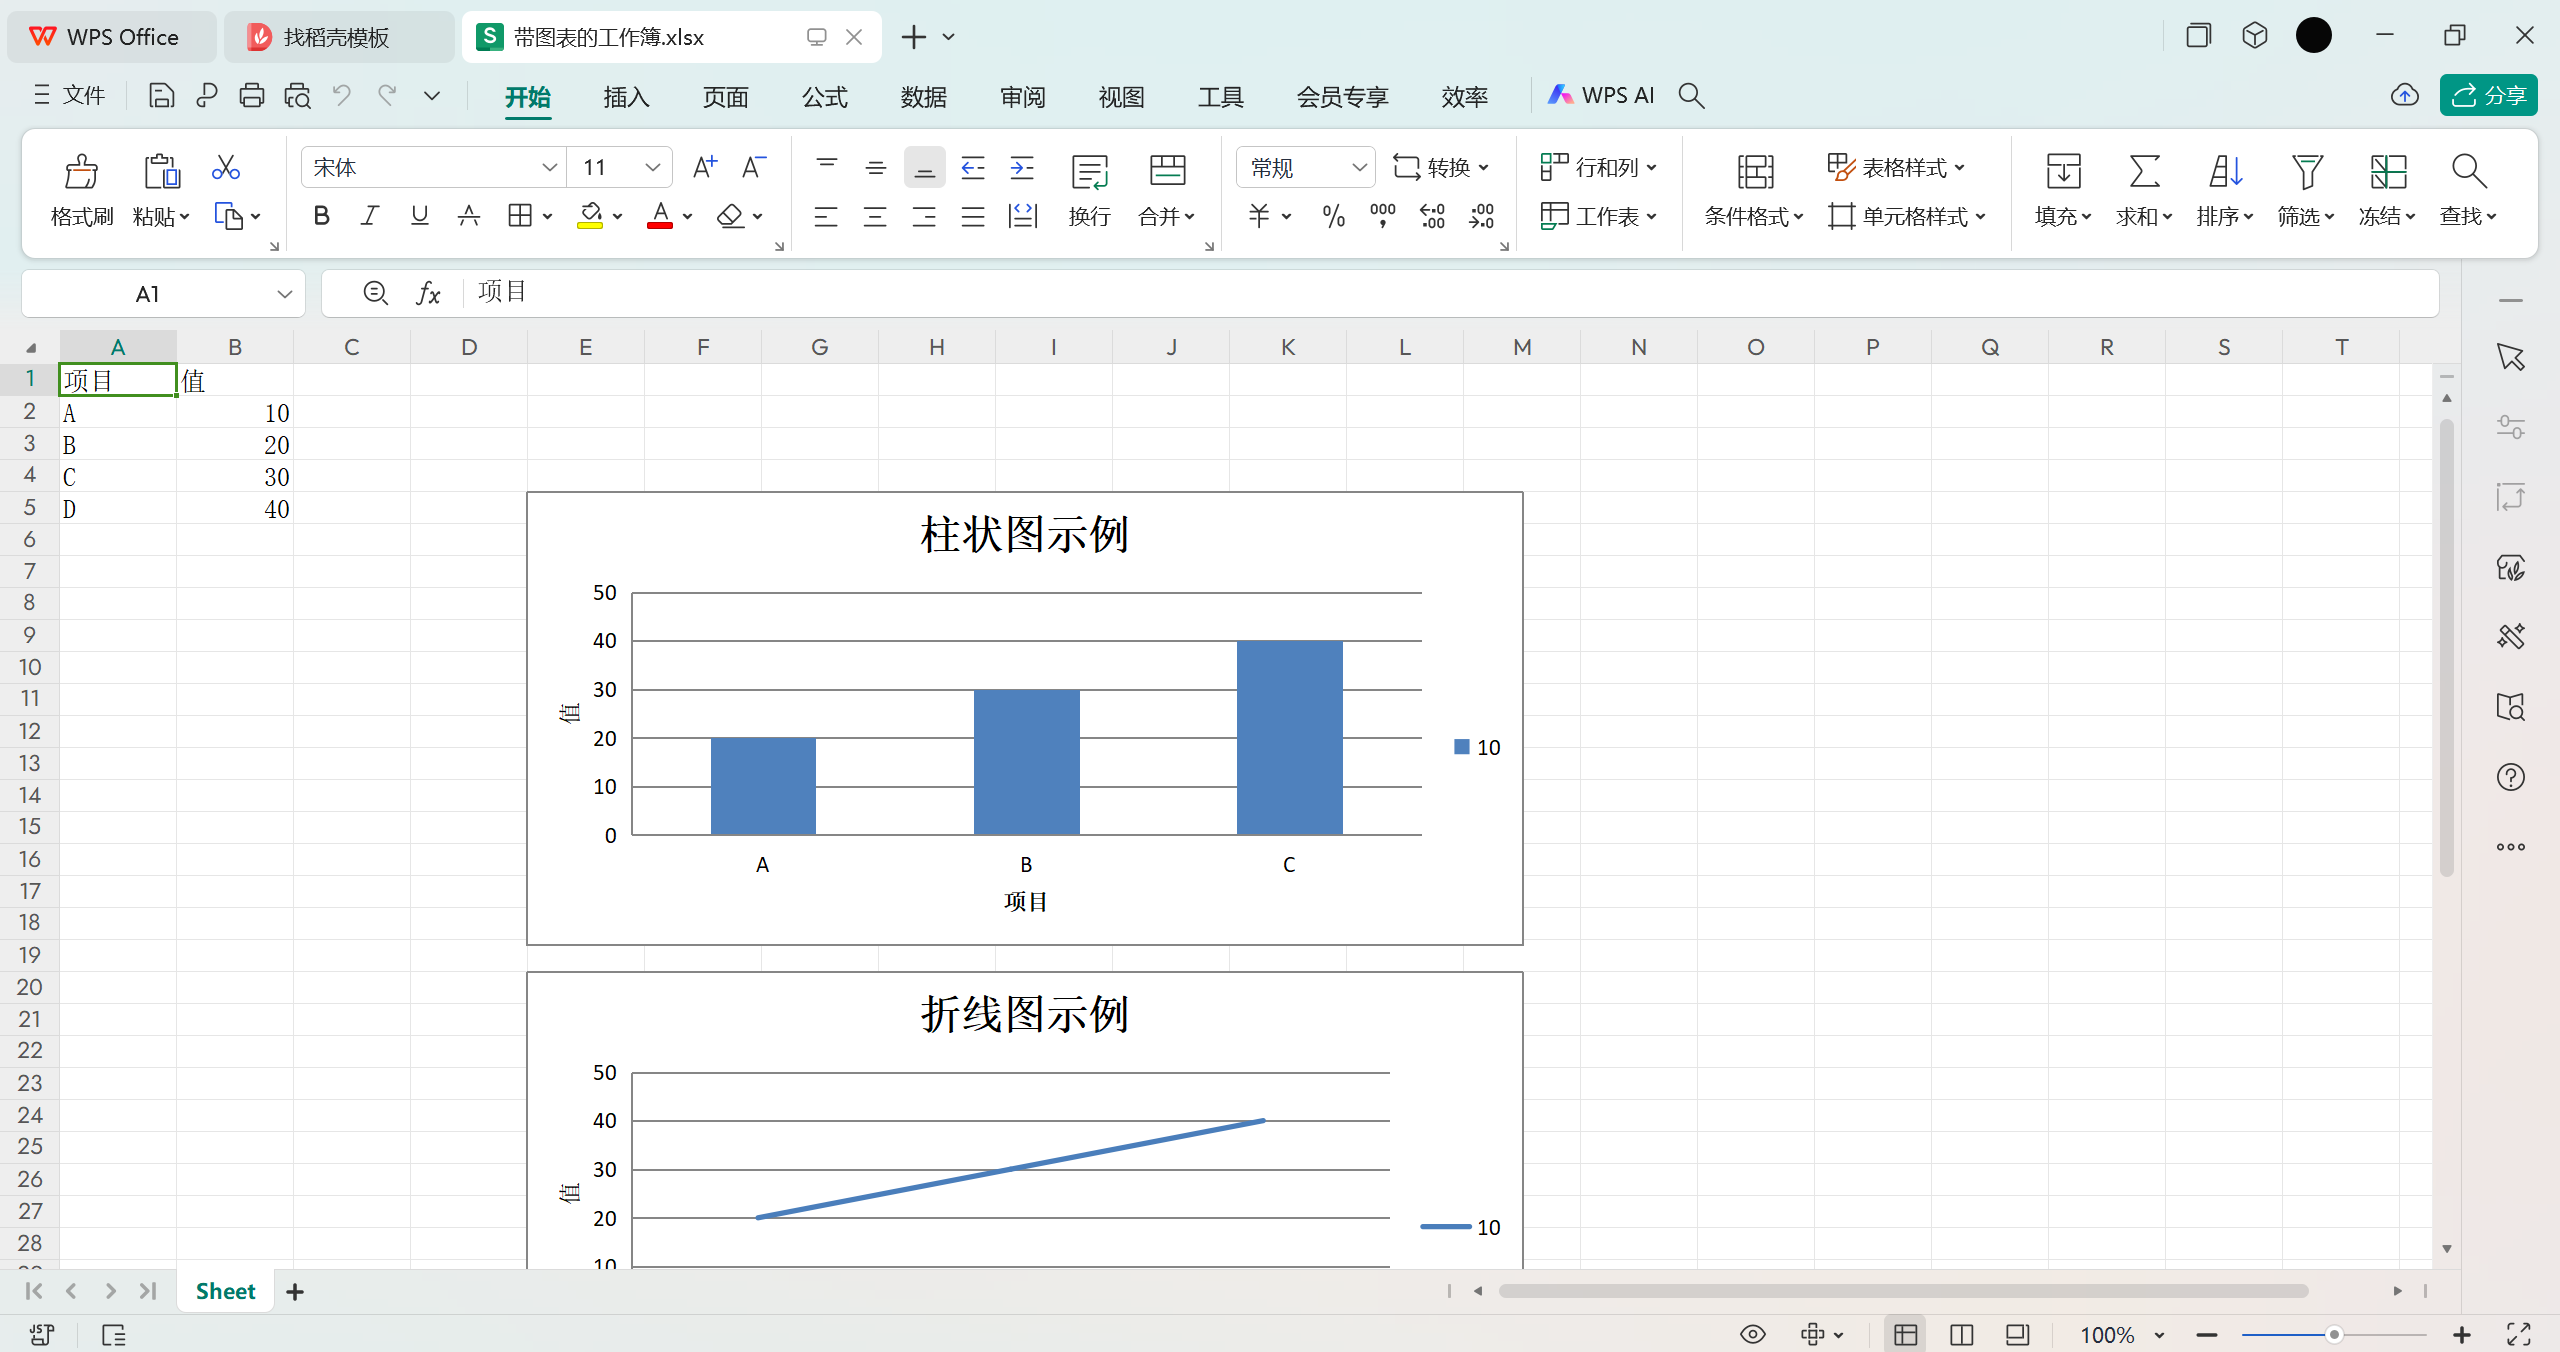
test3生成:


