【性能调优】Arthas
官网:https://arthas.aliyun.com/zh-cn/
动手实验室

可以参考官网提供的样例进行命令学习
一、安装&启动Arthas
-
启动
curl -O https://arthas.aliyun.com/arthas-boot.jar
java -jar arthas-boot.jar
执行该程序的用户需要和目标进程具有相同的权限。比如以
admin用户来执行:sudo su admin && java -jar arthas-boot.jar或sudo -u admin -EH java -jar arthas-boot.jar。如果attach不上目标进程,可以查看
~/logs/arthas/目录下的日志。如果下载速度比较慢,可以使用aliyun的镜像:
java -jar arthas-boot.jar --repo-mirror aliyun --use-http
java -jar arthas-boot.jar -h打印更多参数信息。
-
选择待监控应用java进程序号
二、基本命令
dashboard
展示当前进程的信息,定时刷新,按ctrl+c可以中断
thread
查看当前的线程列表
thread 线程ID
查看指定线程ID
[arthas@4252]$ thread 1
"main" Id=1 TIMED_WAITING
at java.lang.Thread.sleep(Native Method)
at java.lang.Thread.sleep(Unknown Source)
at java.util.concurrent.TimeUnit.sleep(Unknown Source)
at demo.MathGame.main(MathGame.java:17)
$ thread 1 | grep 'main('
at demo.MathGame.main(MathGame.java:17)
查看CPU使用率top n线程的栈
thread -n 3
查看5秒内的CPU使用率top n线程栈
thread -n 3 -i 5000
查找线程是否有阻塞
thread -b
jad 反编译
watch 查看方法返回值
二、JVM相关
三、class/classloader相关
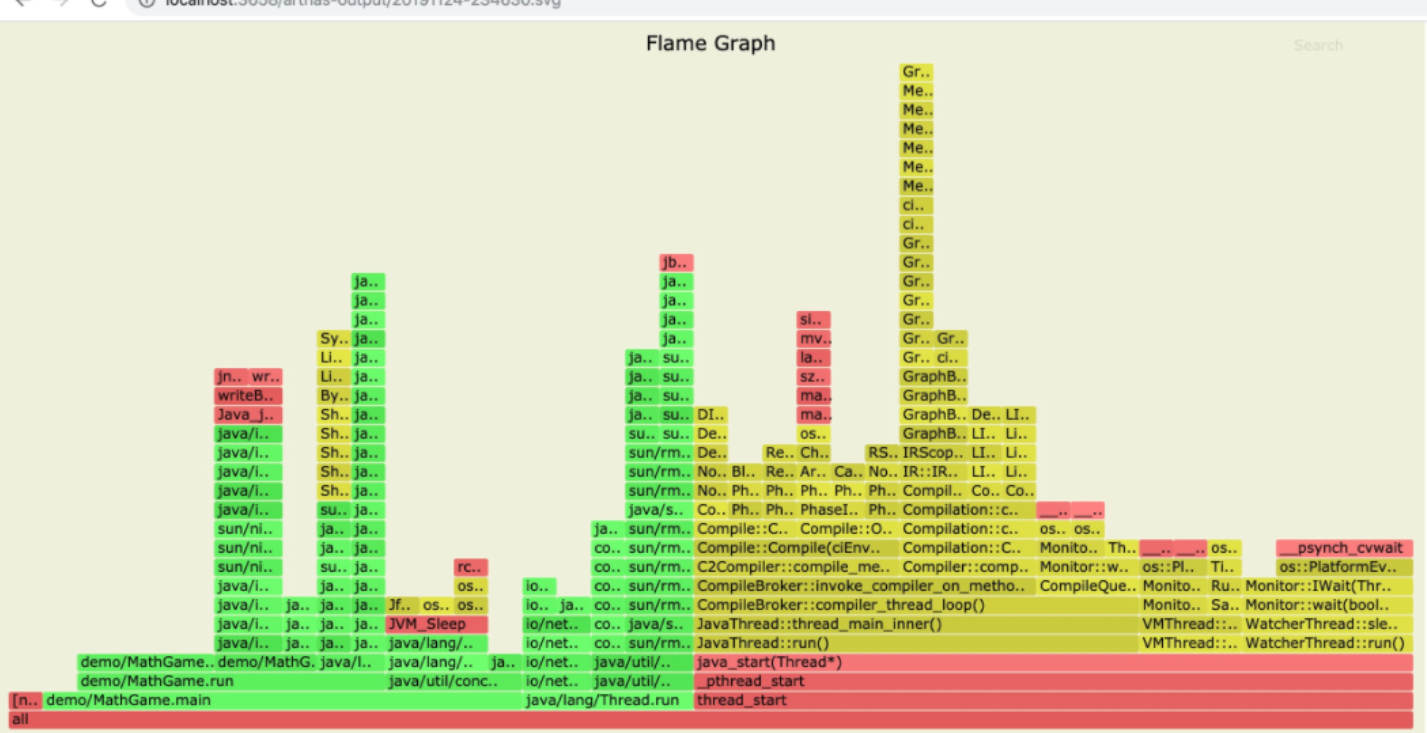
四、profiler/火焰图
应用场景:CPU高问题
操作
# 启动(默认生成的是cpu的火焰图,即event为`cpu`。可以用`--event`参数来指定。) $ profiler start Started [cpu] profiling # 获取已采集的sample的数量 $ profiler getSamples 23 # 查看profiler状态 $ profiler status [cpu] profiling is running for 4 seconds # 停止profiler,生成svg格式图片 $profiler stop profiler output file: /tmp/demo/arthas-output/20191125-135546.svg OK # 指定导出文件位置 $ profiler stop --file /tmp/output.svg profiler output file: /tmp/output.svg OK # 生成HTML格式 $ profiler stop --format html profiler output file: /tmp/test/arthas-output/20191125-143329.html OK # 通过浏览器查看arthas-output下面的profiler结果 http://localhost:3658/arthas-output/ 查看到arthas-output目录下面的profiler结果:
# profiler支持的events $ profiler list Basic events: cpu alloc lock wall itimer Perf events: page-faults context-switches cycles instructions cache-references cache-misses branches branch-misses bus-cycles L1-dcache-load-misses LLC-load-misses dTLB-load-misses mem:breakpoint trace:tracepoint # 指定要采样的事件 $ profiler start --event alloc # 恢复采样 start是新开始采样,resume会保留上次stop时的数据。 $ profiler resume Started [cpu] profiling # 查看所有支持的action $ profiler actions Supported Actions: [resume, dumpCollapsed, getSamples, start, list, execute, version, stop, load, dumpFlat, actions, dumpTraces, status]

 浙公网安备 33010602011771号