饼图
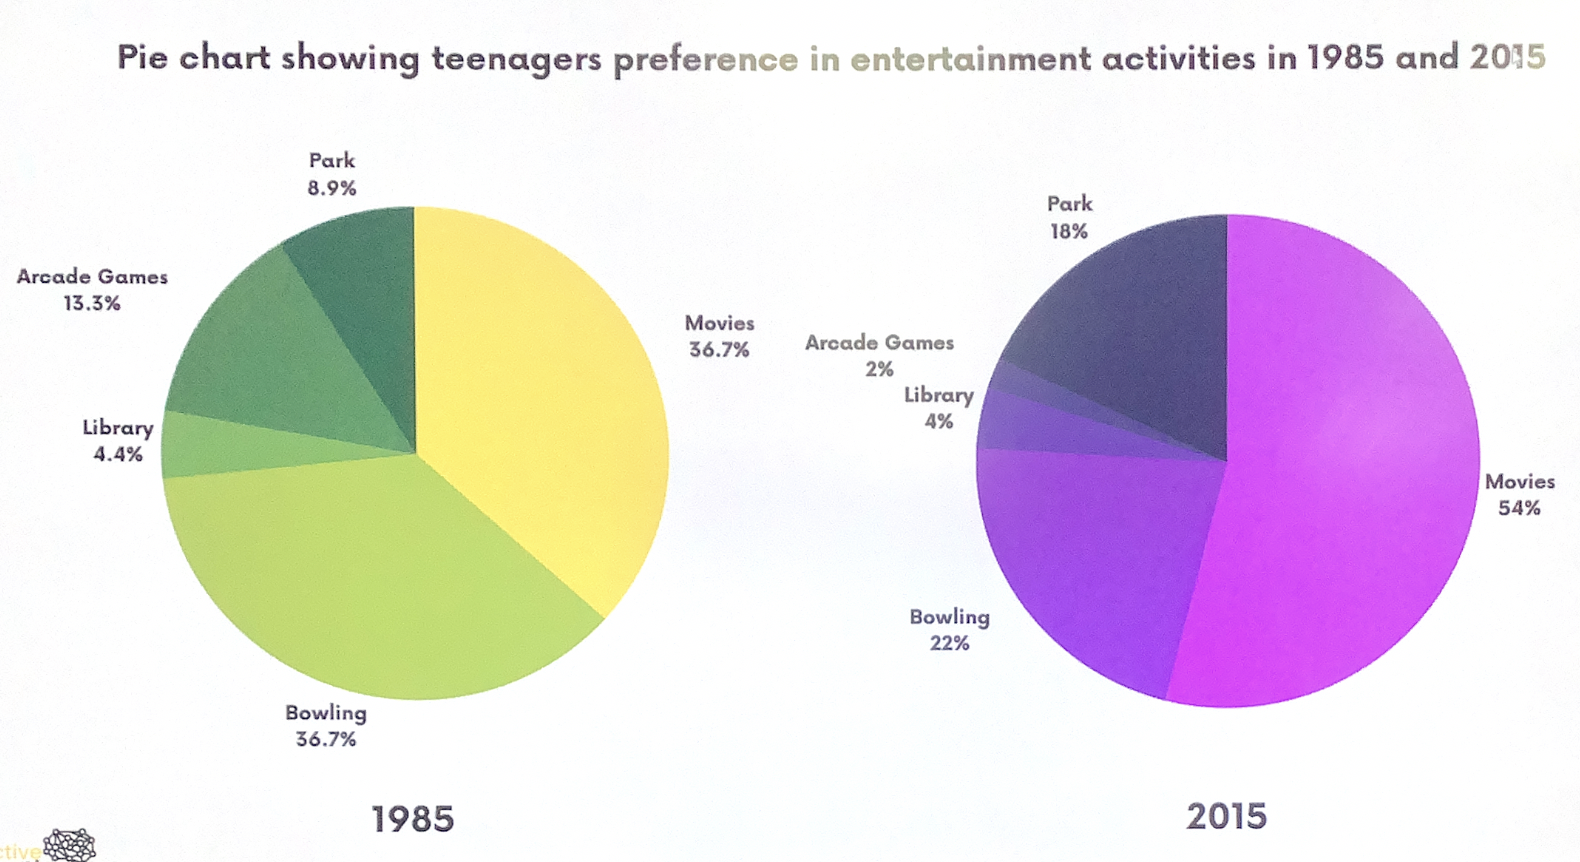
The pie charts provide information on the preferences of leisisure activities amongst teenagers measured between two specific years, namely 1985 and 2015.
Overall, it is evident that watching movies rémains the most popular (共性,比例是饼图重要任务)activity over the 30-yearperiod, while visiting the library held the position for being the least favourable (对比是饼图重要任务)in both instances.There was a change in popularity for both arcade games and bowling.(最牛逼的,最菜的,大趋势)
In1985, over a third of the youth enjoyed bowling at 36.7%, which dropped by more than10 percent in 2015 to 22%.(细节是多少,怎么改变,两个以上饼图可以写上升下降)Looking at the chart ,we can clearly see Arcade games decreased in interest down to less than 5% amongst teenagers where as spending time in parks became more and more popular over the years(再来个对比).
(一个对比)

 浙公网安备 33010602011771号