使用python的第三方绘图库mayavi绘制不同尺寸的球
使用 python 的第三方绘图库 mayavi 绘制不同尺寸的球
“万恶”的 mayavi 库,琢磨了老半天,才弄清楚怎么根据球心坐标和半径绘制出一个球。
解决方案
mayavi 的 mlab 类似 matplotlib 的 pyplot, 其中points3d函数用来绘制一些三维空间的离散点,在实际情况中,一个点必然需要一种“表示方式”,在points3d函数中,提供了"sphere", "point", "cylinder", "cone", "cube", "2darrow", "2dcircle"等很多模式,即用“球、点、圆柱、圆锥、方块、二维箭头、二维圆”等来表示一个点,当选择"point"时,往往可能由于点的可视感太低而显示出来的结果“啥都没有”,所以此函数默认的图例模式为"sphere"。由此引发感想,若可控制每个球的大小,那么不就可以用这些球来表示出自己想画的一些球了嘛。
于是通过研究mlab.points3d()函数发现,可以传入若干球的球心坐标对应的x,y,z,以及相应的半径r,然后设置好scale_factor、resolution、mode参数即可。这三个参数和r参数的说明如下:
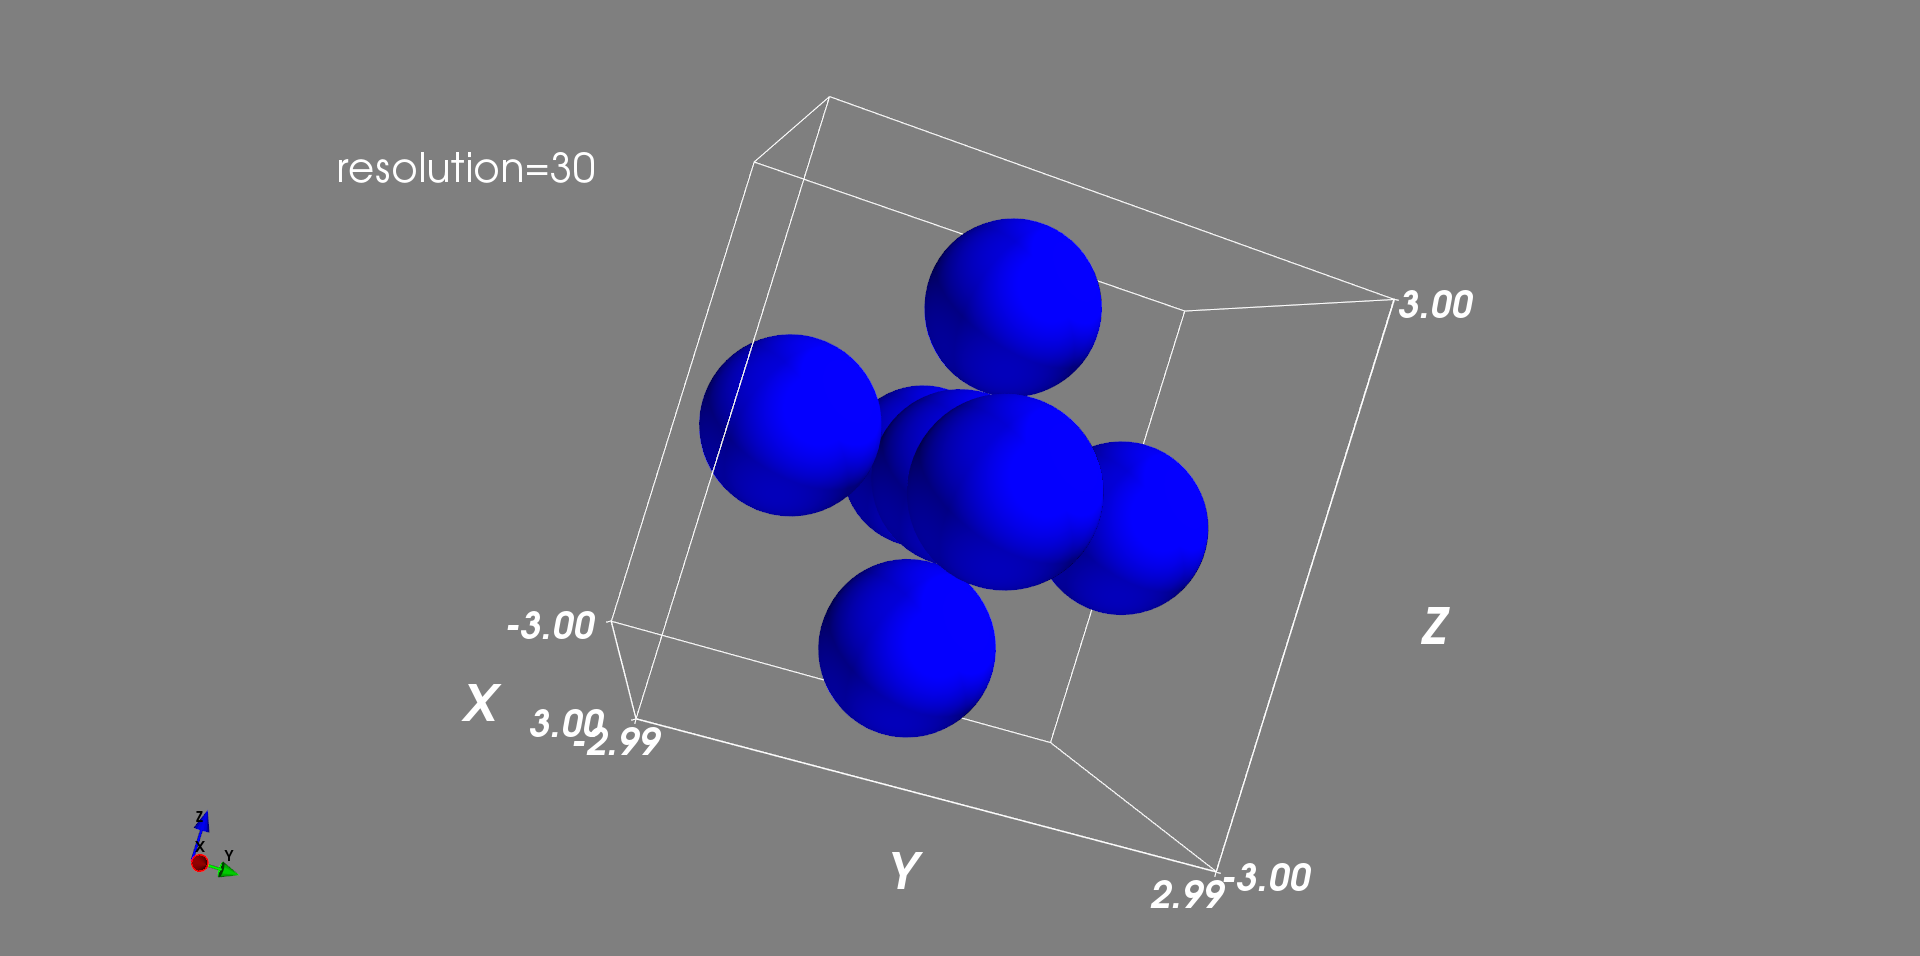
scale_factor:缩放因子,mayavi 的官方文档说得很含糊,其到底怎么发挥作用的完全没有说清楚,这里经过多次试验总结为:将其设置为scale_factor=1的话,即会按传入的“大小参数”r进行一比一缩放,这个参数可视为不存在。resolution:每一个点(球)的解析度/分辨率,为整数,默认值为 8,默认值为 8 时可明显看出用球表示点时球有“棱角”,这里将其设置为 30。
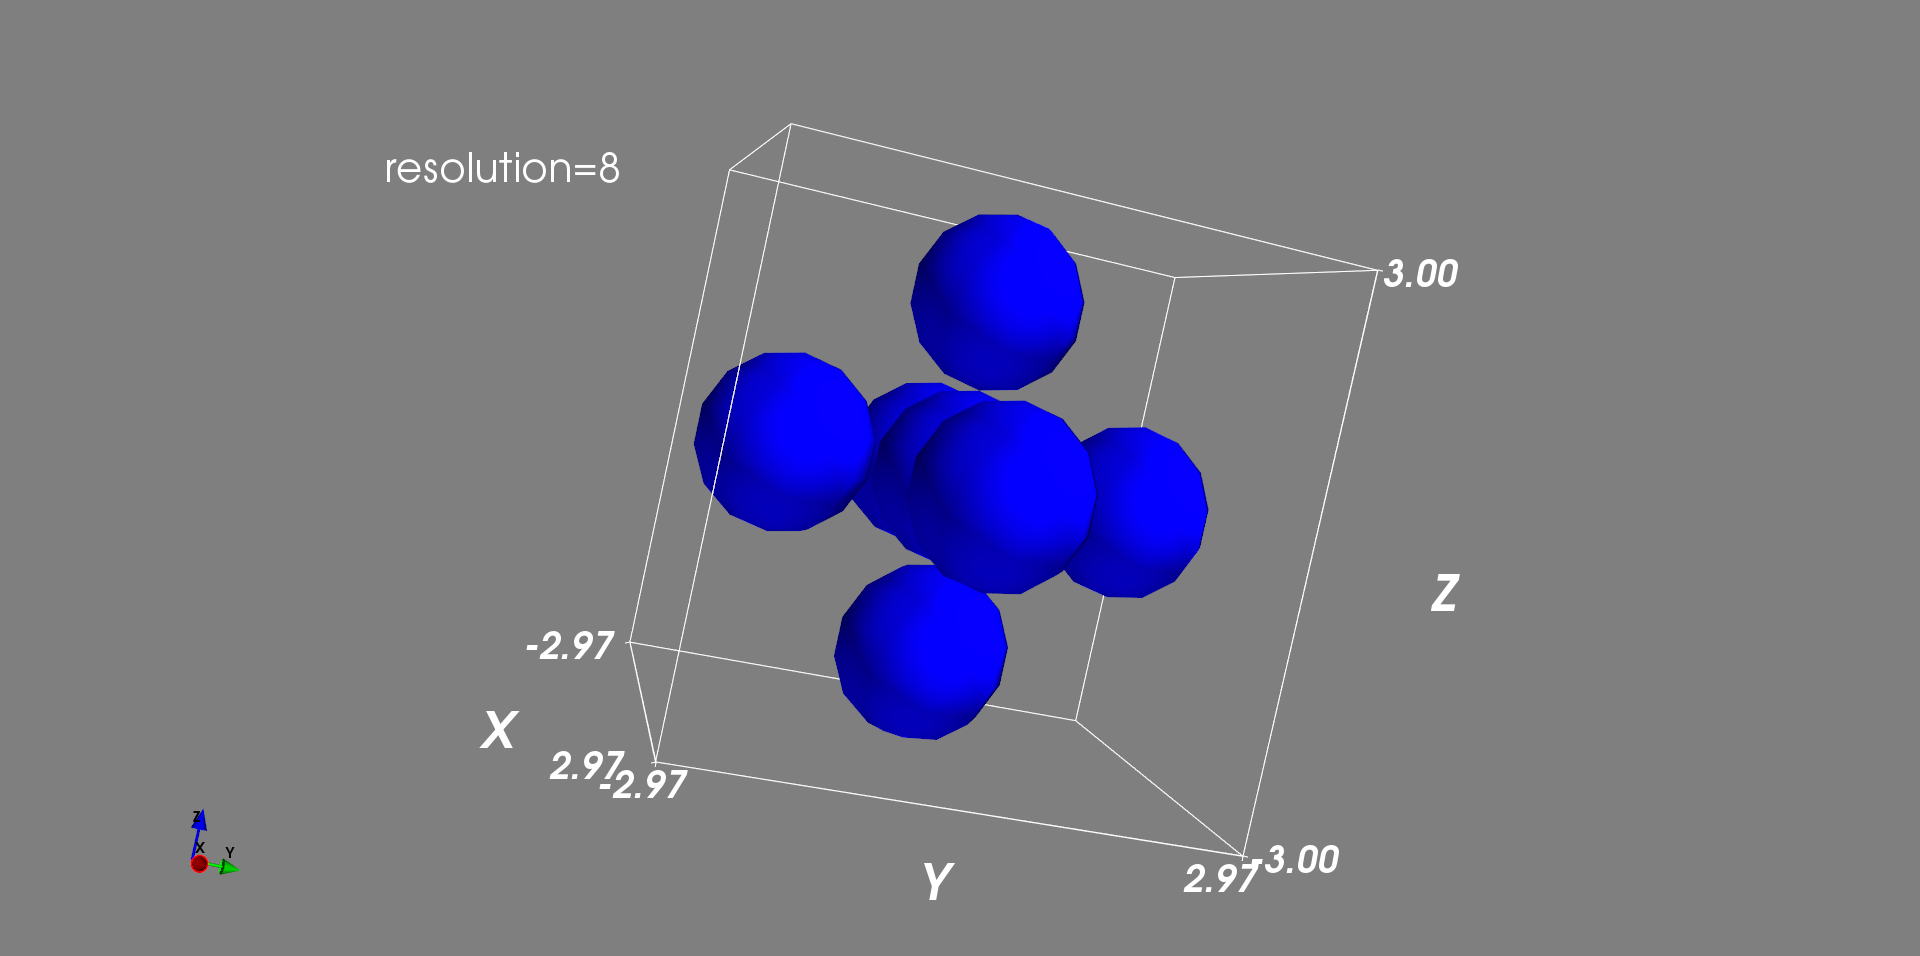
观察这里的坐标,显然,resolution参数还会一定程度上影响计算的精度吧,毕竟表面是计算后渲染出来的!咳,这点以后再说吧,目前只是需要绘制图形效果。
mode:其实可以不设置,默认情况即是用 sphere 作为点的的图例,这里拿出来只是作为强调,应该设置为mode="sphere"。r:按照官方文档,严格来说这不是r参数,其形参名为s,但不管叫什么,它就是表示points3d函数绘制出来的点的大小的一个参数。这里经过多次试验,发现它的数值表示的“大小含义”,对于mode="sphere"来说就是球的直径,对于mode="cube"来说就是立方体的边长,对于mode="cone"来说就是圆锥的高,对于mode="cylinder"来说就是圆柱的高。概括而言,在内部实现中,这种对应关系是否有统一理论指导其代码实现尚不得而知。
于是,这样绘制你的球:mlab.points3d(x, y, z, r*2, scale_factor=1, resolution=30)。
示例
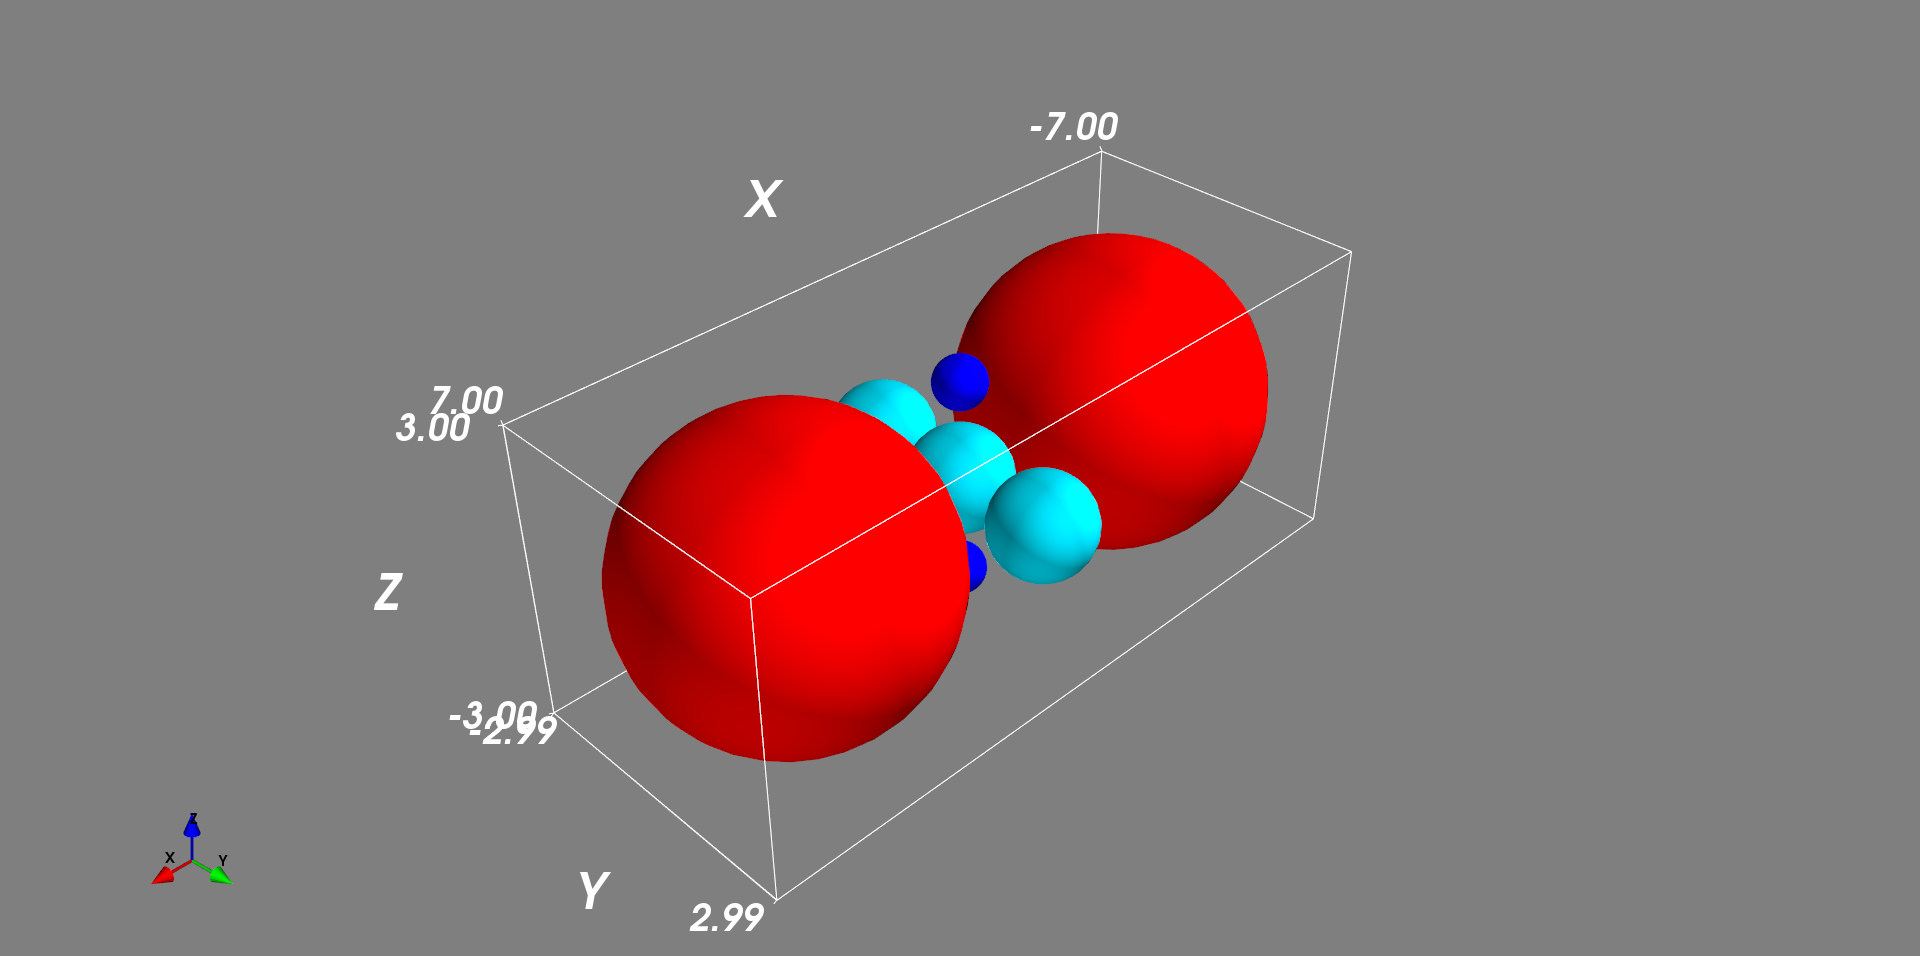
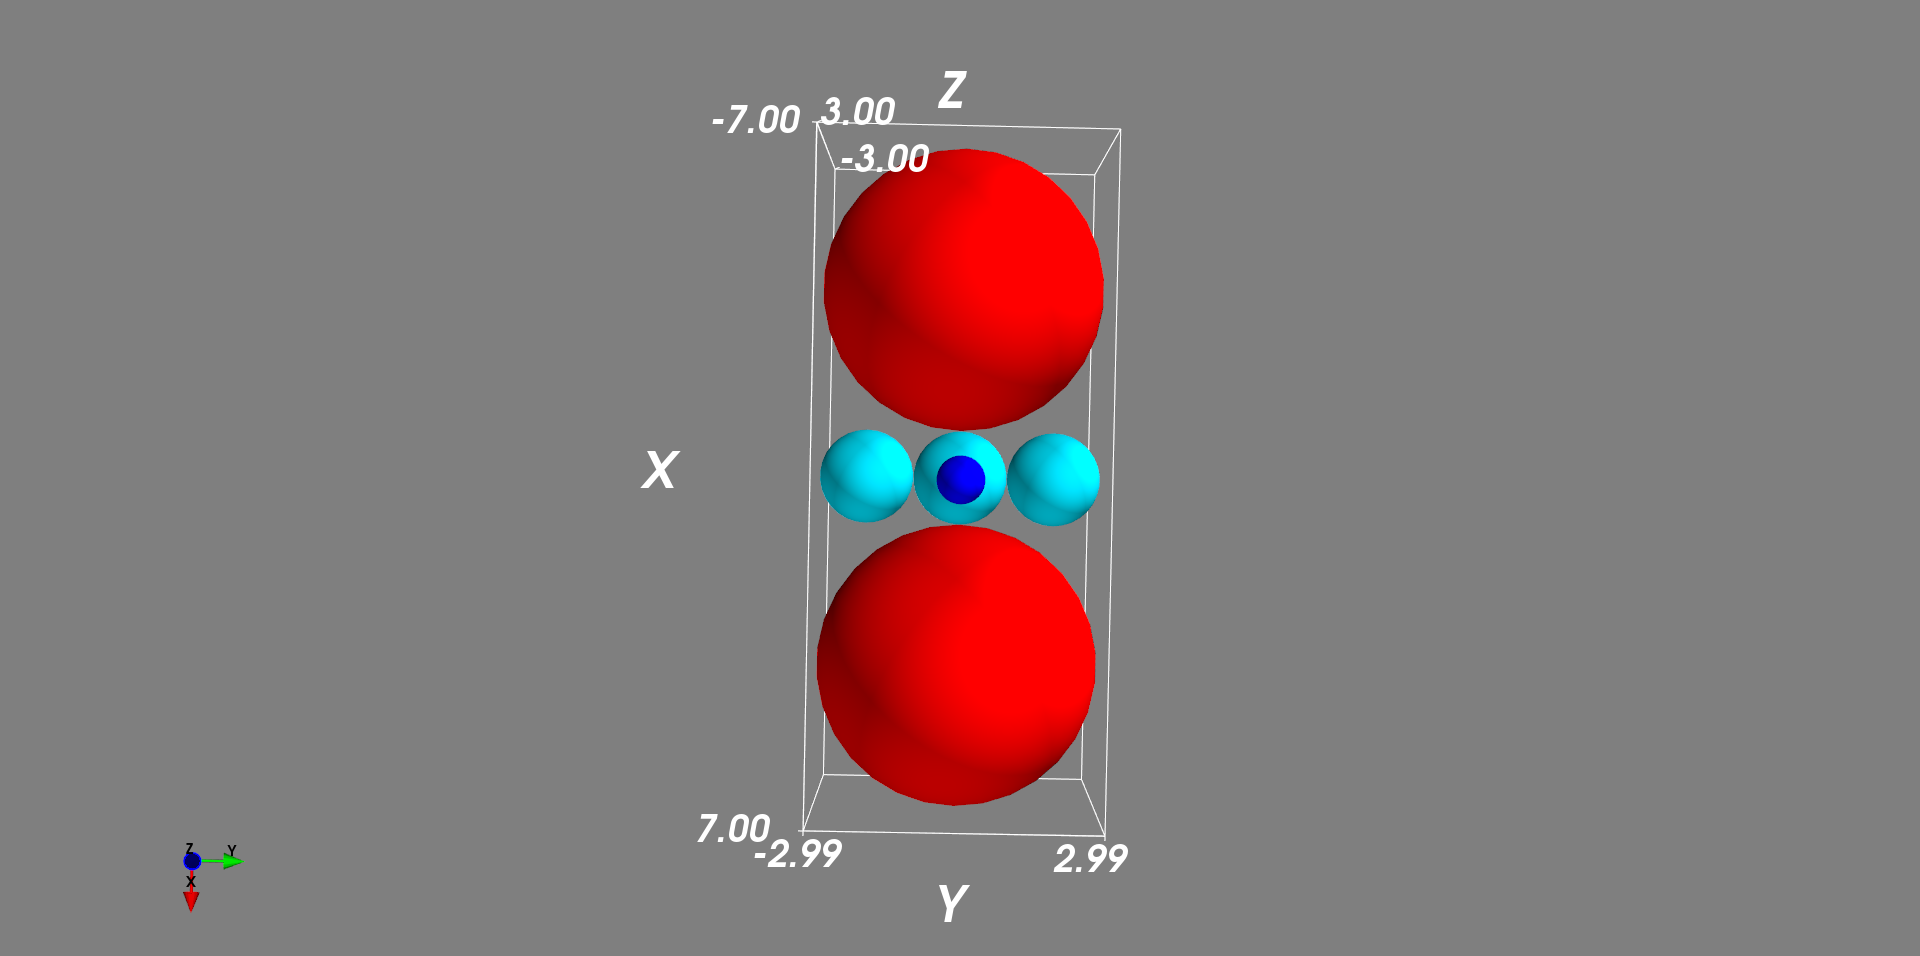
设置一个位于原点的单位球,然后在其上、下、左、右、前、后再各放置 1 个球,检验他们的相切情况。
import numpy as np
from mayavi import mlab


points = np.array([[0, 0, 0, 1],
                   [4, 0, 0, 3],
                   [-4, 0, 0, 3],
                   [0, 2, 0, 1],
                   [0, -2, 0, 1],
                   [0, 0, 2, 0.5],
                   [0, 0, -2, 0.5]])

x, y, z, r = points[:, 0], points[:, 1], points[:, 2], points[:, 3]

mlab.points3d(x, y, z, r*2, scale_factor=1, resolution=30, mode="sphere")
mlab.outline()
mlab.axes()
mlab.show()

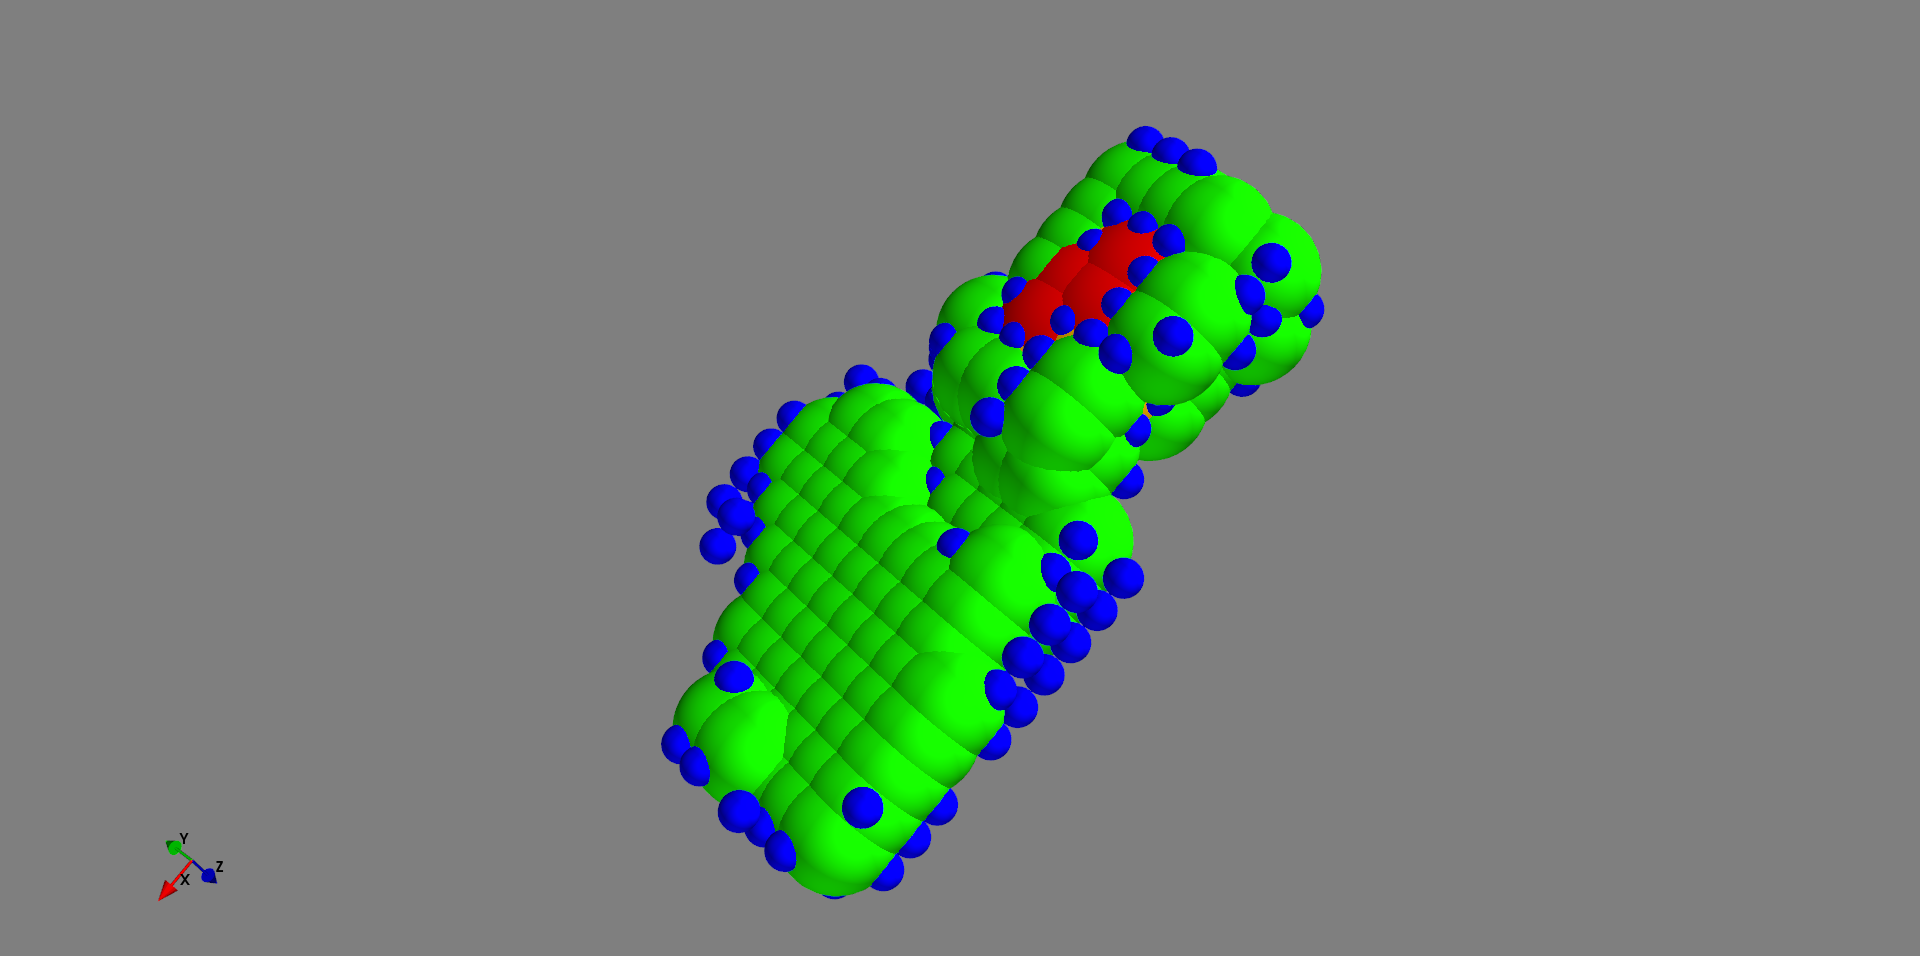
附1:我本来想要画的球堆积颗粒模型:
附2:原本我采用的绘球函数:
若要在一张图上绘制很多球的话,这种方式只能使用for循环一个球一个球地进行绘制,效率比较低,硬件成本也比较高。也是为此一直在研究points3d函数的。
import random
import numpy as np


class Plotter:
    random.seed(3.14)

    @classmethod
    def randomColor(cls):
        color = (random.random(), random.random(), random.random())
        return color

    @classmethod
    def sphere(cls, center, radius, nPoints=100, opacity=1.0, color=None):
        """Draw a sphere according to given center and radius.

        Parameters:
        -----------
        center(tuple): (x, y, z) coordinate
        radius(float): radius of the sphere
        """
        u = np.linspace(0, 2 * np.pi, nPoints)
        v = np.linspace(0, np.pi, nPoints)
        x = radius * np.outer(np.cos(u), np.sin(v)) + center[0]
        y = radius * np.outer(np.sin(u), np.sin(v)) + center[1]
        z = radius * np.outer(np.ones(np.size(u)), np.cos(v)) + center[2]
        from mayavi import mlab
        color = cls.randomColor() if color is None else color
        scene = mlab.mesh(x, y, z, color=color, opacity=opacity)
        return scene
附3:mlab.points3d函数的官方文档:
mayavi.mlab.points3d(*args, **kwargs)
Plots glyphs (like points) at the position of the supplied data.
Function signatures:
points3d(x, y, z...)
points3d(x, y, z, s, ...)
points3d(x, y, z, f, ...)
x, y and z are numpy arrays, or lists, all of the same shape, giving the positions of the points.
If only 3 arrays x, y, z are given, all the points are drawn with the same size and color.
In addition, you can pass a fourth array s of the same shape as x, y, and z giving an associated scalar value for each point, or a function f(x, y, z) returning the scalar value. This scalar value can be used to modulate the color and the size of the points.
Keyword arguments:
color: the color of the vtk object. Overides the colormap, if any, when specified. This is specified as a triplet of float ranging from 0 to 1, eg (1, 1, 1) for white. colormap: type of colormap to use. extent: [xmin, xmax, ymin, ymax, zmin, zmax] Default is the x, y, z arrays extent. Use this to change the extent of the object created. figure: Figure to populate. line_width: The width of the lines, if any used. Must be a float. Default: 2.0 mask_points: If supplied, only one out of ‘mask_points’ data point is displayed. This option is useful to reduce the number of points displayed on large datasets Must be an integer or None. mode: the mode of the glyphs. Must be ‘2darrow’ or ‘2dcircle’ or ‘2dcross’ or ‘2ddash’ or ‘2ddiamond’ or ‘2dhooked_arrow’ or ‘2dsquare’ or ‘2dthick_arrow’ or ‘2dthick_cross’ or ‘2dtriangle’ or ‘2dvertex’ or ‘arrow’ or ‘axes’ or ‘cone’ or ‘cube’ or ‘cylinder’ or ‘point’ or ‘sphere’. Default: sphere name: the name of the vtk object created. opacity: The overall opacity of the vtk object. Must be a float. Default: 1.0 reset_zoom: Reset the zoom to accomodate the data newly added to the scene. Defaults to True. resolution: The resolution of the glyph created. For spheres, for instance, this is the number of divisions along theta and phi. Must be an integer. Default: 8 scale_factor: The scaling applied to the glyphs. the size of the glyph is by default calculated from the inter-glyph spacing. Specify a float to give the maximum glyph size in drawing units scale_mode: the scaling mode for the glyphs (‘vector’, ‘scalar’, or ‘none’). transparent: make the opacity of the actor depend on the scalar. vmax: vmax is used to scale the colormap. If None, the max of the data will be used vmin: vmin is used to scale the colormap. If None, the min of the data will be used
