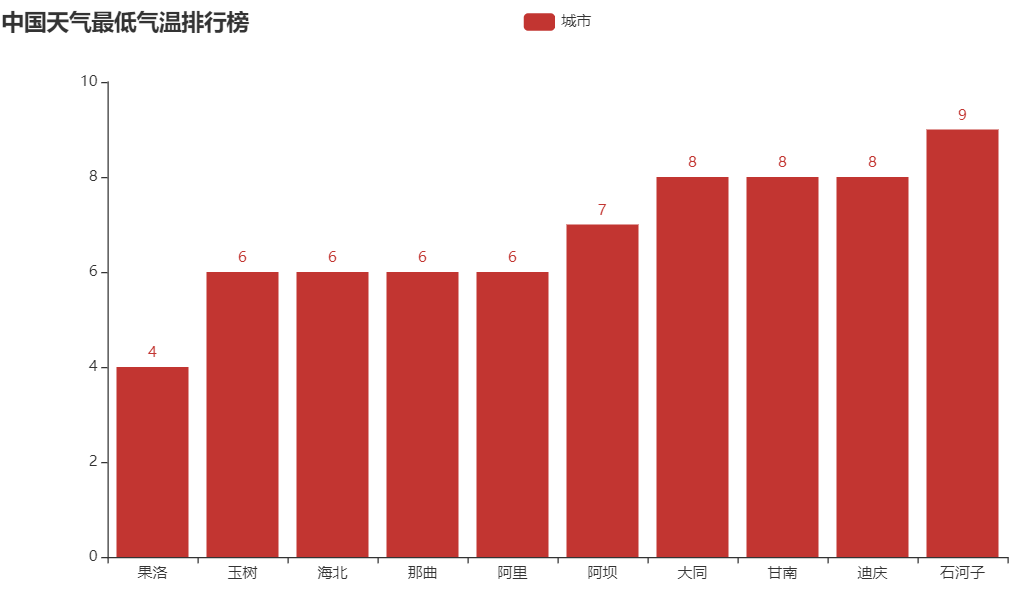
爬取中国天气网 | 对最低温排名前十城市进行可视化
可视化需要用的的库:
from  pyecharts.charts  import Bar
from pyecharts import options as opts
可视化的核心代码:
    # 原有的这 个方式无效了
    # chart = Bar({"中国天气最低气温排行榜"})
    # chart.add('',cities,temps)
    # chart.render('temperature.html')
    chart = Bar()
    chart.add_xaxis(cities)
    chart.add_yaxis("城市",temps)
    chart.set_global_opts(title_opts=opts.TitleOpts(title="中国天气最低气温排行榜"))
    chart.render('temperature.html')

#encoding: utf-8

import requests
from bs4 import BeautifulSoup
from  pyecharts.charts  import Bar
from pyecharts import options as opts
'''
pyecharts 用来画图表的,bar:柱状图
'''

ALL_DATA = []

def parse_page(url):
    headers = {
        'User-Agent': "Mozilla/5.0 (Windows NT 10.0; Win64; x64) AppleWebKit/537.36 (KHTML, like Gecko) Chrome/62.0.3202.94 Safari/537.36"
    }
    response = requests.get(url,headers=headers)
    text = response.content.decode('utf-8')
    # html5lib
    # pip install html5lib
    soup = BeautifulSoup(text,'html5lib')
    conMidtab = soup.find('div',class_='conMidtab')
    tables = conMidtab.find_all('table')
    for table in tables:
        trs = table.find_all('tr')[2:]
        for index,tr in enumerate(trs):
            tds = tr.find_all('td')
            city_td = tds[0]
            if index == 0:
                city_td = tds[1]
            city = list(city_td.stripped_strings)[0]
            temp_td = tds[-2]
            min_temp = list(temp_td.stripped_strings)[0]
            ALL_DATA.append({"city":city,"min_temp":int(min_temp)})
            print({"city":city,"min_temp":int(min_temp)})

def main():
    urls = [
        'http://www.weather.com.cn/textFC/hb.shtml',
        'http://www.weather.com.cn/textFC/db.shtml',
        'http://www.weather.com.cn/textFC/hd.shtml',
        'http://www.weather.com.cn/textFC/hz.shtml',
        'http://www.weather.com.cn/textFC/hn.shtml',
        'http://www.weather.com.cn/textFC/xb.shtml',
        'http://www.weather.com.cn/textFC/xn.shtml',
        'http://www.weather.com.cn/textFC/gat.shtml'
    ]
    for url in urls:
        parse_page(url)

    # 分析数据
    # 根据最低气温进行排序
    ALL_DATA.sort(key=lambda data:data['min_temp'])

    data = ALL_DATA[0:10]
    cities = list(map(lambda x:x['city'],data))
    temps = list(map(lambda x:x['min_temp'],data))
    # pyecharts
    # pip install pyecharts
    # 原有的这 个方式无效了
    # chart = Bar({"中国天气最低气温排行榜"})
    # chart.add('',cities,temps)
    # chart.render('temperature.html')
    chart = Bar()
    chart.add_xaxis(cities)
    chart.add_yaxis("城市",temps)
    chart.set_global_opts(title_opts=opts.TitleOpts(title="中国天气最低气温排行榜"))
    chart.render('temperature.html')


if __name__ == '__main__':
    main()
    # ALL_DATA = [
    #     {"city": "北京", 'min_temp': 0},
    #     {"city": "天津", 'min_temp': -8},
    #     {"city": "石家庄", 'min_temp': -10}
    # ]
    #
    # ALL_DATA.sort(key=lambda data:data['min_temp'])
    # print(ALL_DATA)


<!DOCTYPE html>
<html>
<head>
    <meta charset="UTF-8">
    <title>Awesome-pyecharts</title>
            <script type="text/javascript" src="https://assets.pyecharts.org/assets/echarts.min.js"></script>

</head>
<body>
    <div id="8d8789eafca0473299441d8a914fe0d0" class="chart-container" style="width:900px; height:500px;"></div>
    <script>
        var chart_8d8789eafca0473299441d8a914fe0d0 = echarts.init(
            document.getElementById('8d8789eafca0473299441d8a914fe0d0'), 'white', {renderer: 'canvas'});
        var option_8d8789eafca0473299441d8a914fe0d0 = {
    "animation": true,
    "animationThreshold": 2000,
    "animationDuration": 1000,
    "animationEasing": "cubicOut",
    "animationDelay": 0,
    "animationDurationUpdate": 300,
    "animationEasingUpdate": "cubicOut",
    "animationDelayUpdate": 0,
    "color": [
        "#c23531",
        "#2f4554",
        "#61a0a8",
        "#d48265",
        "#749f83",
        "#ca8622",
        "#bda29a",
        "#6e7074",
        "#546570",
        "#c4ccd3",
        "#f05b72",
        "#ef5b9c",
        "#f47920",
        "#905a3d",
        "#fab27b",
        "#2a5caa",
        "#444693",
        "#726930",
        "#b2d235",
        "#6d8346",
        "#ac6767",
        "#1d953f",
        "#6950a1",
        "#918597"
    ],
    "series": [
        {
            "type": "bar",
            "name": "\u57ce\u5e02",
            "data": [
                4,
                6,
                6,
                6,
                6,
                7,
                8,
                8,
                8,
                9
            ],
            "barCategoryGap": "20%",
            "label": {
                "show": true,
                "position": "top",
                "margin": 8
            }
        }
    ],
    "legend": [
        {
            "data": [
                "\u57ce\u5e02"
            ],
            "selected": {
                "\u57ce\u5e02": true
            },
            "show": true
        }
    ],
    "tooltip": {
        "show": true,
        "trigger": "item",
        "triggerOn": "mousemove|click",
        "axisPointer": {
            "type": "line"
        },
        "textStyle": {
            "fontSize": 14
        },
        "borderWidth": 0
    },
    "xAxis": [
        {
            "show": true,
            "scale": false,
            "nameLocation": "end",
            "nameGap": 15,
            "gridIndex": 0,
            "inverse": false,
            "offset": 0,
            "splitNumber": 5,
            "minInterval": 0,
            "splitLine": {
                "show": false,
                "lineStyle": {
                    "width": 1,
                    "opacity": 1,
                    "curveness": 0,
                    "type": "solid"
                }
            },
            "data": [
                "\u679c\u6d1b",
                "\u7389\u6811",
                "\u6d77\u5317",
                "\u90a3\u66f2",
                "\u963f\u91cc",
                "\u963f\u575d",
                "\u5927\u540c",
                "\u7518\u5357",
                "\u8fea\u5e86",
                "\u77f3\u6cb3\u5b50"
            ]
        }
    ],
    "yAxis": [
        {
            "show": true,
            "scale": false,
            "nameLocation": "end",
            "nameGap": 15,
            "gridIndex": 0,
            "inverse": false,
            "offset": 0,
            "splitNumber": 5,
            "minInterval": 0,
            "splitLine": {
                "show": false,
                "lineStyle": {
                    "width": 1,
                    "opacity": 1,
                    "curveness": 0,
                    "type": "solid"
                }
            }
        }
    ],
    "title": [
        {
            "text": "\u4e2d\u56fd\u5929\u6c14\u6700\u4f4e\u6c14\u6e29\u6392\u884c\u699c"
        }
    ]
};
        chart_8d8789eafca0473299441d8a914fe0d0.setOption(option_8d8789eafca0473299441d8a914fe0d0);
    </script>
</body>
</html>


