
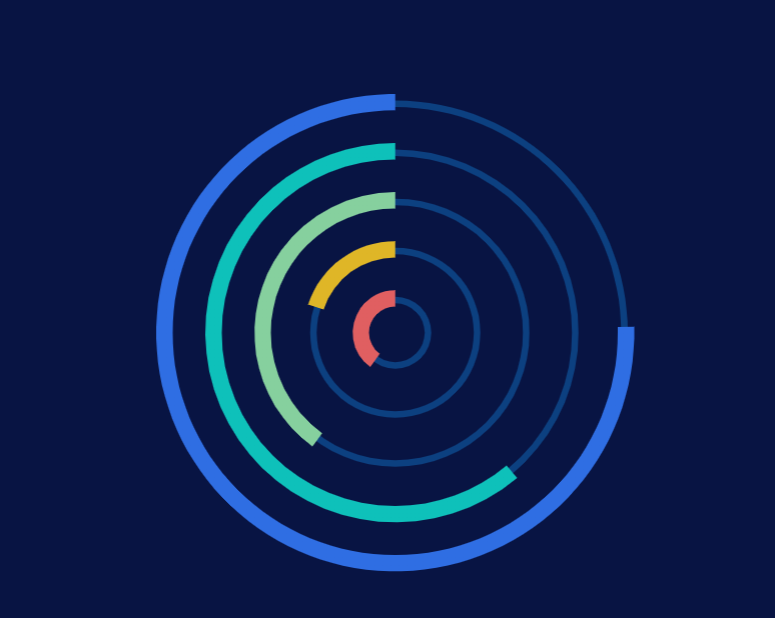
多个pie环形图 逆时针旋转
效果图如下
代码如下
data = [
  {
    name: "经济目的",
    value: 754,
  },
  {
    name: "网络安全爱好者",
    value: 611,
  },
  {
    name: "数据窃取",
    value: 400,
  },
  {
    name: "炫技",
    value: 200,
  },
  {
    name: "国家对抗",
    value: 400,
  },
  {
    name: "其他",
    value: 200,
  },
];
arrName = getArrayValue(data, "name");
arrValue = getArrayValue(data, "value");
sumValue = 1000;
objData = array2obj(data, "name");
optionData = getData(data);

function getArrayValue(array, key) {
  var key = key || "value";
  var res = [];
  if (array) {
    array.forEach(function (t) {
      res.push(t[key]);
    });
  }
  return res;
}

function array2obj(array, key) {
  var resObj = {};
  for (var i = 0; i < array.length; i++) {
    resObj[array[i][key]] = array[i];
  }
  return resObj;
}

function getData(data) {
  var res = {
    series: [

    ],
    yAxis: [],
  };
  for (let i = 0; i < data.length; i++) {
    res.series.push({
      name: "学历",
      type: "pie",
      clockWise: false, //逆时针
      z: 2,
      hoverAnimation: false,
      radius: [73 - i * 15 + "%", 68 - i * 15 + "%"],
      center: ["50%", "55%"],
      label: {
        show: false,
        formatter: "{d}%",
        color: "RGB(246,175,101)",
        fontSize: 25,
        position: "inside",
      },
      labelLine: {
        show: false,
      },
      data: [
        {
          value: data[i].value,
          name: data[i].name,
        },
        {
          value: sumValue - data[i].value,
          name: "",
          itemStyle: {
            color: "rgba(0,0,0,0)",
            borderWidth: 0,
          },
          tooltip: {
            show: false,
          },
          label: {
            show: false,
          },
          hoverAnimation: false,
        },
      ],
    });
    res.series.push({
      name: "背景线",
      type: "pie",
      silent: true,
      z: 1,
      clockWise: false, //逆时针
      hoverAnimation: false,
      radius: [71 - i * 15 + "%", 69 - i * 15 + "%"],
      center: ["50%", "55%"],
      label: {
        show: false,
      },
      itemStyle: {
        label: {
          show: false,
        },
        labelLine: {
          show: false,
        },
        borderWidth: 5,
      },
      data: [
        {
          value: 100,
          itemStyle: {
            color: "RGB(12,64,128)",
            borderWidth: 0,
          },
          tooltip: {
            show: false,
          },
          hoverAnimation: false,
        },
      ],
    });
    res.yAxis.push(data[i].name);
  }
  return res;
}

option = {
  backgroundColor: "RGB(8,20,67)",
  color: [
    {
      type: "linear",
      x: 0,
      y: 0,
      x2: 1,
      y2: 1,
      colorStops: [
        {
          offset: 0,
          color: "rgba(47,110,227,1)",
        },
        {
          offset: 1,
          color: "rgba(47,110,227,1)",
        },
      ],
      global: false,
    },
    {
      type: "linear",
      x: 0,
      y: 0,
      x2: 1,
      y2: 1,
      colorStops: [
        {
          offset: 0,
          color: "rgba(14,193,186,1)",
        },
        {
          offset: 1,
          color: "rgba(14,193,186,1)",
        },
      ],
      global: false,
    },
    {
      type: "linear",
      x: 0,
      y: 0,
      x2: 1,
      y2: 1,
      colorStops: [
        {
          offset: 0,
          color: "rgba(134,208,158,1)",
        },
        {
          offset: 1,
          color: "rgba(134,208,158,1)",
        },
      ],
      global: false,
    },
    {
      type: "linear",
      x: 0,
      y: 0,
      x2: 1,
      y2: 1,
      colorStops: [
        {
          offset: 0,
          color: "rgba(223,182,39,1)",
        },
        {
          offset: 1,
          color: "rgba(223,182,39,1)",
        },
      ],
      global: false,
    },
    {
      type: "linear",
      x: 0,
      y: 0,
      x2: 1,
      y2: 1,
      colorStops: [
        {
          offset: 0,
          color: "rgba(224,95,97,1)",
        },
        {
          offset: 1,
          color: "rgba(224,95,97,1)",
        },
      ],
      global: false,
    },
  ],
  grid: {
    top: "16%",
    bottom: "54%",
    left: "50%",
    containLabel: false,
  },
  yAxis: [
    {
      type: "category",
      inverse: true,
      z: 3,
      axisLine: {
        show: false,
      },
      axisTick: {
        show: false,
      },
      axisLabel: {
        interval: 0,
        inside: false,
        textStyle: {
          color: "RGB(78,184,252)",
          fontSize: 25,
        },
        show: false,
      },
      data: optionData.yAxis,
    },
  ],
  xAxis: [
    {
      show: false,
    },
  ],
  series: optionData.series,
};

