
Echarts 圆形立体柱状图
先放个效果图
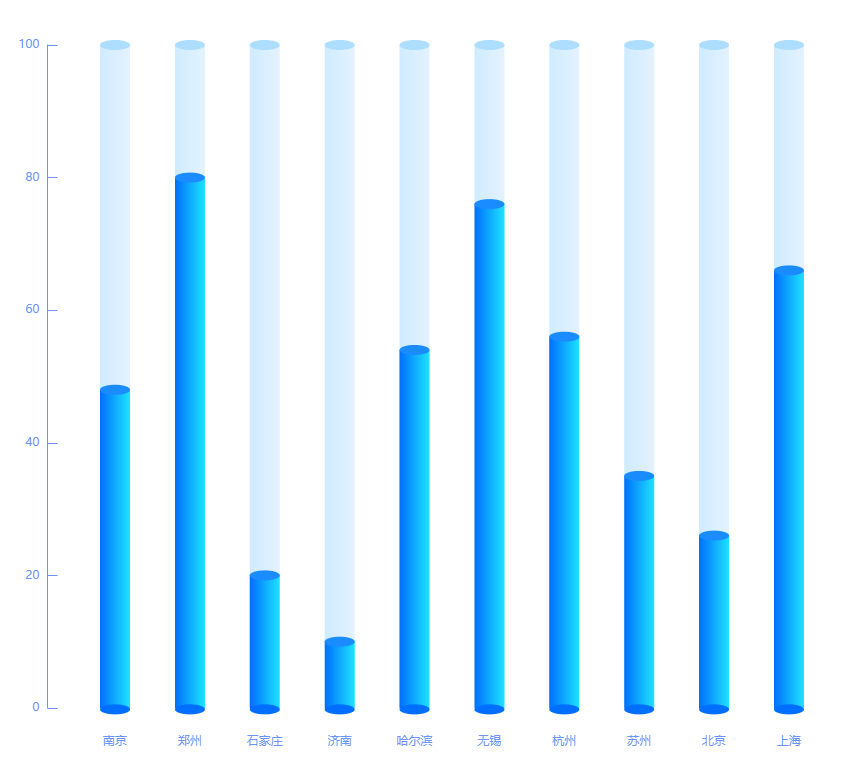
const resData = [
        { label: "上海", value: 66 },
        { label: "北京", value: 26 },
        { label: "苏州", value: 35 },
        { label: "杭州", value: 56 },
        { label: "无锡", value: 76 },
        { label: "哈尔滨", value: 54 },
        { label: "济南", value: 10 },
        { label: "石家庄", value: 20 },
        { label: "郑州", value: 80 },
        { label: "南京", value: 48 },
      ];
//   取最大值 (数据的最大值或根据项目实际情况)
const maxValueData = [100, 100, 100, 100, 100, 100, 100, 100, 100, 100];
option = {
    title: {
        text: '',
    },
    xAxis: {
        type: 'category',
        inverse: true,
        offset: 20,
        axisLabel: {
            show: true,
            interval: 'auto',
            color: 'rgb(106, 148, 255)',
        },
        axisLine: {
            show: false,
        },
        axisTick: {
            show: false,
        },
        data: resData.map((item) => {
              return item.label;
            }),
    },
    yAxis: {
        type: 'value',
        offset: 30,
        axisLine: {
            show: true,
            lineStyle: {
                color: 'rgb(106, 148, 255)',
            },
        },
        splitLine: {
            show: false,
        },
        axisTick: {
            show: true,
            inside: true,
            length: 10,
        },
        axisLabel: {
            show: true,
            interval: 'auto',
            formatter: '{value}',
        },
    },
    series: [
        {
            // 上半截柱子(背部阴影bar)
            name: '2019',
            type: 'bar',
            barWidth: '30',
            barGap: '-100%',
            z: 0,
            itemStyle: {
                //lenged文本
                opacity: 1,
                color: function (params) {
                    return new echarts.graphic.LinearGradient(0,0,1, 0,
                        [
                            {
                                offset: 0,
                                color: 'rgba(207, 235, 255)', // 0% 处的颜色
                            },
                            {
                                offset: 1,
                                color: 'rgba(228, 242, 255)', // 100% 处的颜色
                            },
                        ],
                        false
                    );
                },
            },
            data: maxValueData,
        },
        {
            ///最顶部圆片(背部阴影最顶部圆片)
            name: '',
            type: 'pictorialBar',
            symbolSize: [30,10],
            symbolOffset: [0, -5],
            z: 3,
            symbolPosition: 'end',
            itemStyle: {
                color: 'rgb(174, 222, 255)',
                opacity: 1,
            },
            data: maxValueData,
        },
        {
            //数据柱子 (蓝色柱子)
            name: '2020',
            type: 'bar',
            barWidth: 30,
            barGap: '-100%',
            itemStyle: {
                //lenged文本
                opacity: 1,
                color: function (params) {
                    return new echarts.graphic.LinearGradient( 0,0,1,0,
                        [
                            {
                                offset: 0,
                                color: 'rgba(0, 111, 255)', // 0% 处的颜色
                            },
                            {
                                offset: 1,
                                color: 'rgba(29, 227, 255)', // 100% 处的颜色
                            },
                        ],
                        false
                    );
                },
            },
            data: resData.map((item) => {
              return item.value;
            }),
        },
        {
            //数据圆片(蓝色柱子的顶部圆片)
            name: '',
            type: 'pictorialBar',
            symbolSize: [30, 10],
            symbolOffset: [0, -5],
            z: 3,
            itemStyle: {
                opacity: 1,
                color: 'rgb(27, 140, 255)'
            },
            symbolPosition: 'end',
            data: resData.map((item) => {
              return item.value;
            }),
            // 柱子顶部显示值
            // label: {
            //     show: true,
            //     position: 'top',
            //     distance: 0,
            //     formatter: '{c}'
            // },

        },
        {
            //最底部圆片
            name: '',
            type: 'pictorialBar',
            symbolSize: [30, 10],  //圆片的形状大小
            symbolOffset: [0, 3],  //圆片的偏移量
            z: 3,
            itemStyle: {
                opacity: 1,
                color: 'rgb(0, 111, 255)'
                //color: '#000'
            },
            symbolPosition: 'end',
            data: [1, 1, 1, 1, 1,1, 1, 1, 1, 1],
        },
    ],
};

