Echarts 柱状图hover时单条柱子自动高亮的效果
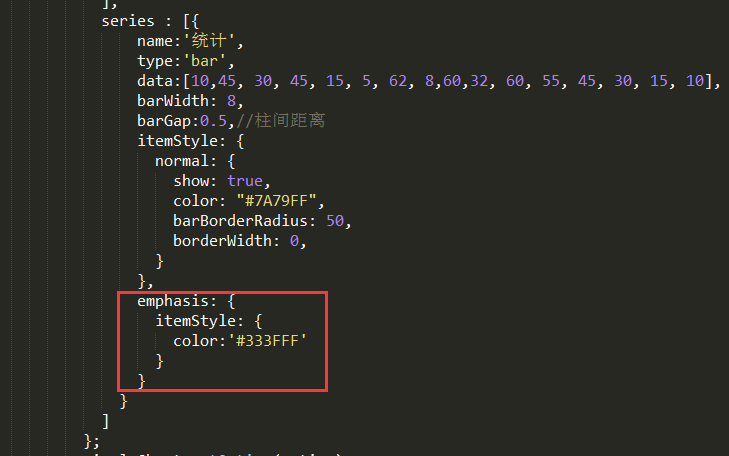
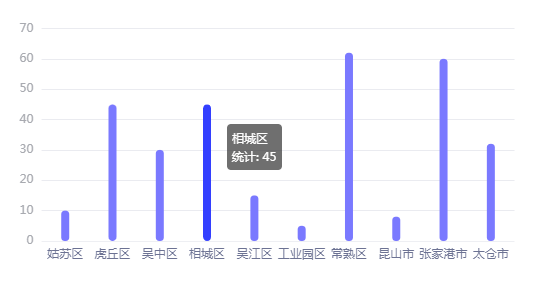
itemStyle的emphasis是鼠标 hover 时候的高亮样式。只需series内添加

效果如下图所示

贴全部vue代码

  1 <!-- 单个柱状-柱状图 -->
  2 <template>
  3     <div ref="singleColumn"></div>
  4 </template>
  5 <script>
  6     export default {
  7       name: "singleColumn",
  8       data() {
  9         return {
 10           timmerOneAnim: null
 11         }
 12       },
 13       methods: {
 14         getsingleColumnChart() {
 15             var namedata =  ['姑苏区', '虎丘区', '吴中区','相城区','吴江区','工业园区','常熟区','昆山市','张家港市', '太仓市'];
 16           var singleChart = this.$echarts.init(this.$refs.singleColumn);
 17           var option = {
 18                     tooltip: { //提示框组件
 19                         trigger: 'axis',
 20                         formatter: '{b}<br/>{a0}: {c0}',
 21                         axisPointer: {
 22                             type: 'none',
 23                             label: {
 24                                 backgroundColor: '#6a7985'
 25                             }
 26                         },
 27                         textStyle: {
 28                             color: '#fff',
 29                             fontStyle: 'normal',
 30                             fontFamily: '微软雅黑',
 31                             fontSize: 12,
 32                         }
 33                     },
 34                     grid: {
 35                         top:"15%",
 36               bottom:"10%",
 37               right:'5%',
 38               left:'5%',
 39                         containLabel: true,
 40                     },
 41                     xAxis: [
 42                         {
 43                             type: 'category',
 44                             data:namedata,
 45                             axisLabel: { //坐标轴刻度标签的相关设置。
 46                               interval: 0,//设置为 1,表示『隔一个标签显示一个标签』
 47                                 textStyle: {
 48                                     color: '#6C7293',
 49                                     fontStyle: 'normal',
 50                                     fontFamily: '微软雅黑',
 51                                     fontSize: 12,
 52                                 },
 53                                 rotate:0,
 54                             },
 55                             axisTick:{//坐标轴刻度相关设置。
 56                                 show: false,
 57                             },
 58                             axisLine:{//坐标轴轴线相关设置
 59                                 lineStyle:{
 60                                     color:'#fff',
 61                                     opacity:0.2
 62                                 }
 63                             },
 64                             splitLine: { //坐标轴在 grid 区域中的分隔线。
 65                                 show: false,
 66                             }
 67                         }
 68                     ],
 69                     yAxis: [
 70                         {
 71                             type: 'value',
 72                             splitNumber: 5,
 73                             axisLabel: {
 74                                 textStyle: {
 75                                     color: '#a8aab0',
 76                                     fontStyle: 'normal',
 77                                     fontFamily: '微软雅黑',
 78                                     fontSize: 12,
 79                                 }
 80                             },
 81                             axisLine:{
 82                                 show: false
 83                             },
 84                             axisTick:{
 85                                 show: false
 86                             },
 87                             splitLine: {
 88                                 show: true,
 89                                 lineStyle: {
 90                                     color: '#EAEBF0',
 91                                 }
 92                             }
 93                         }
 94                     ],
 95                 series : [{
 96                 name:'统计',
 97                 type:'bar',
 98                 data:[10,45, 30, 45, 15, 5, 62, 8,60,32, 60, 55, 45, 30, 15, 10],
 99                 barWidth: 8,
100                 barGap:0.5,//柱间距离
101                   itemStyle: {
102                 normal: {
103                   show: true,
104                   color: "#7A79FF",
105                   barBorderRadius: 50,
106                   borderWidth: 0,
107                 }
108                   },
109                   emphasis: {
110                       itemStyle: {
111                           color:'#333FFF'
112                       }
113                   }
114                 }
115                 ]
116                 };
117           singleChart.setOption(option);
118           // tooltip定时移动
119           var count = 0;
120           if(this.timmerOneAnim){
121               clearInterval(this.timmerOneAnim);
122           }
123           this.timmerOneAnim = setInterval(() => {
124               singleChart.dispatchAction({
125                   type: "showTip",
126                   seriesIndex: 0,
127                   dataIndex: count % namedata.length
128               });
129               count++;
130            }, 5000);
131         }
132       },
133       mounted() {
134           this.getsingleColumnChart()
135       }
136     };
137 </script>
138 <style>
139 </style>


