
Echarts 动态折线
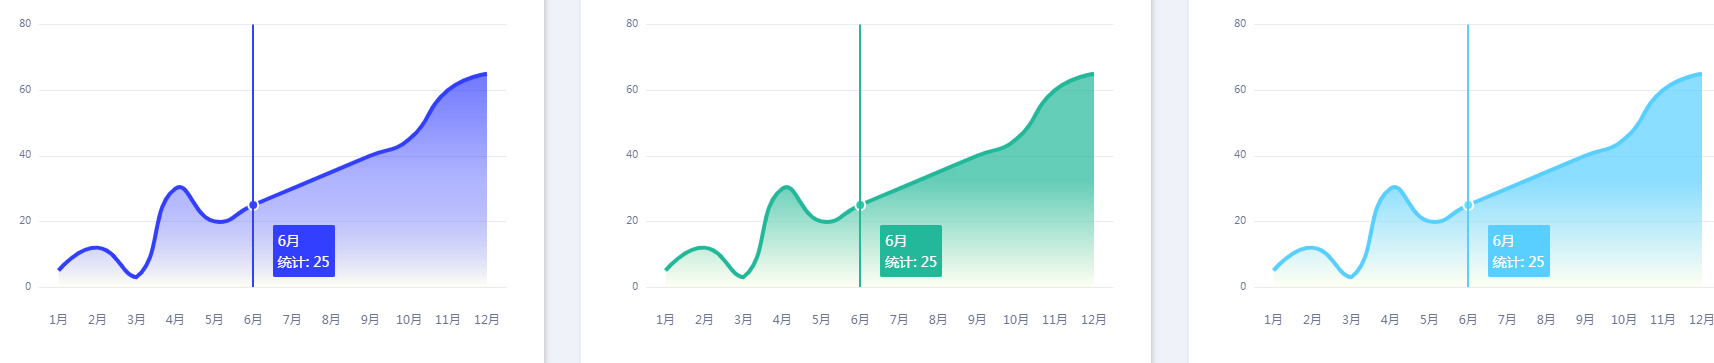
1.简述:项目中一个页面有三处需要这个动态折线,标线隔几秒动一次
效果图如下
2.父组件(未贴样式)
 1 <template>
 2   <div class="public">
 3       <v-LineChart ref="LineChart1"></v-LineChart>
 4       <v-LineChart ref="LineChart2"></v-LineChart>
 5        <v-LineChart ref="LineChart3"></v-LineChart>
 6   </div>
 7 </template>
 8 <script>
 9 import BrokenLine from "./BrokenLine";
10 export default {
11   name: "public",
12   data() {
13     return {
14     };
15   },
16   components: {
17     "v-LineChart": BrokenLine
18
19   },
20   methods: { },
21   mounted() {
22     this.$refs.LineChart1.getBrokenLineChart("bzdz");
23     this.$refs.LineChart2.getBrokenLineChart("bzdm");
24     this.$refs.LineChart3.getBrokenLineChart("poi");
25   }
26 };
27 </script>
3.子组件(vue版)
如果一个页面同时用同一个echarts 好几次,那么子组件内要这样写(div内使用ref而不是id):
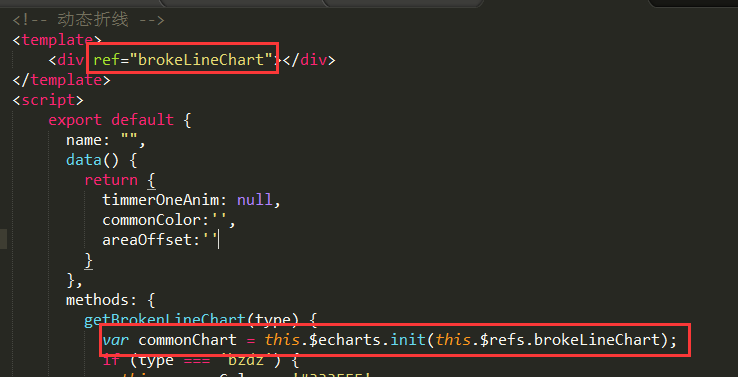
贴上子组件代码,展开即可


  1 <!-- 动态折线 -->
  2 <template>
  3     <div ref="brokeLineChart"></div>
  4 </template>
  5 <script>
  6     export default {
  7       name: "",
  8       data() {
  9         return {
 10           timmerOneAnim: null,
 11           commonColor:'',
 12           areaOffset:''
 13         }
 14       },
 15       methods: {
 16         getBrokenLineChart(type) {
 17           var commonChart = this.$echarts.init(this.$refs.brokeLineChart);
 18           if (type === 'bzdz') {
 19               this.commonColor = '#333FFF'
 20               this.areaOffset = '#333fff8c'
 21           } else if (type === 'bzdm') {
 22               this.commonColor = '#23B899'
 23               this.areaOffset = '#23B899'
 24           } else if (type === 'poi') {
 25               this.commonColor = '#58CFFF'
 26               this.areaOffset = '#58CFFF'
 27           }
 28           let namedata = ['1月','2月','3月','4月','5月','6月','7月','8月','9月','10月','11月','12月'];
 29           let valdata = ['5','12','3','30','20','25','30','35','40','45','60','65'];
 30           let option = {
 31             tooltip: {
 32               trigger: "axis",
 33               backgroundColor: this.commonColor,
 34               borderRadius: 2,
 35               axisPointer: {  //坐标轴指示器
 36                 transitionDuration: 2000,
 37                 animation: true,
 38                 animationDelay: "linear",
 39                 animationDurationUpdate: 2000,
 40                 lineStyle: {
 41                   color:this.commonColor,
 42                   width:2,
 43                   opacity: 1
 44                 }
 45               },
 46               textStyle: {
 47                 color: "#fff",
 48                 fontSize: 14
 49               },
 50               formatter: "{b} <br/>{a}: {c}"
 51             },
 52             legend: {
 53               show: false
 54             },
 55             grid: {
 56               top:"5%",
 57               bottom: "20%",
 58               right:'5%',
 59               // left:'5%'
 60             },
 61             xAxis: [
 62               {
 63                 show: true,
 64                 offset: 20,
 65                 axisLine: {
 66                   show: false
 67                 },
 68                 axisTick: {
 69                   show: false
 70                 },
 71                 axisLabel: {
 72                   interval:0,
 73                   textStyle: {
 74                     color: "#6C7293",
 75                     fontSize: 12
 76                   }
 77                 },
 78                 data: namedata
 79               }
 80             ],
 81             yAxis: [
 82               {
 83                 show: true,
 84                 splitNumber: 4,
 85                 type: "value",
 86                 axisLabel: {
 87                   show: true,
 88                   textStyle: {
 89                     color: "#6C7293",
 90                     fontSize: 10
 91                   }
 92                 },
 93                 axisLine: {
 94                   show: false
 95                 },
 96                 axisTick: {
 97                   show: false
 98                 },
 99                 splitLine: {
100                   show: true,
101                   lineStyle: {
102                     color: "#EAEBF0",
103                     width: 1
104                   }
105                 }
106               }
107             ],
108             series: [
109               {
110                 name: "统计",
111                 type: "line",
112                 smooth: true,
113                 symbol: "circle", //拐点设置为实心
114                 showSymbol:false,
115                 symbolSize: 4, //拐点大小
116                 lineStyle: {
117                   normal: {
118                     color: this.commonColor, //折线的颜色
119                     width: 4, //折线粗细
120                     opacity: 1
121                   }
122                 },
123                 label: {
124                   show: false
125                 },
126                 itemStyle: {
127                   normal:{
128                       color:this.commonColor,//拐点颜色
129                       borderColor:'#fff',//拐点边框颜色
130                       borderWidth:2//拐点边框大小
131                   }
132                 },
133                 areaStyle: {
134                   normal: {
135                     color: new this.$echarts.graphic.LinearGradient(0, 0, 0, 1, [
136                       {
137                         offset: 0,
138                         color: this.commonColor
139                       },
140                       {
141                         offset: 0.5,
142                         color: this.areaOffset
143                       },
144                       {
145                         offset: 1,
146                         color: "#ffe"
147                       }
148                     ])
149                   }
150                 },
151                 data: valdata
152               }
153             ]
154           };
155           commonChart.setOption(option);
156           var count = 0;
157           if(this.timmerOneAnim){
158               clearInterval(this.timmerOneAnim);
159           }
160           this.timmerOneAnim = setInterval(() => {
161               commonChart.dispatchAction({
162                   type: "showTip",
163                   seriesIndex: 0,
164                   dataIndex: count % namedata.length
165               });
166               count++;
167            }, 5000);
168         }
169       },
170       mounted() {}
171     };
172 </script>
173 <style>
174 </style>

