vue中 怎么把echarts中data的数据循环
1.。后台返回的数据格式是下图这样的,然后取name和commonCount
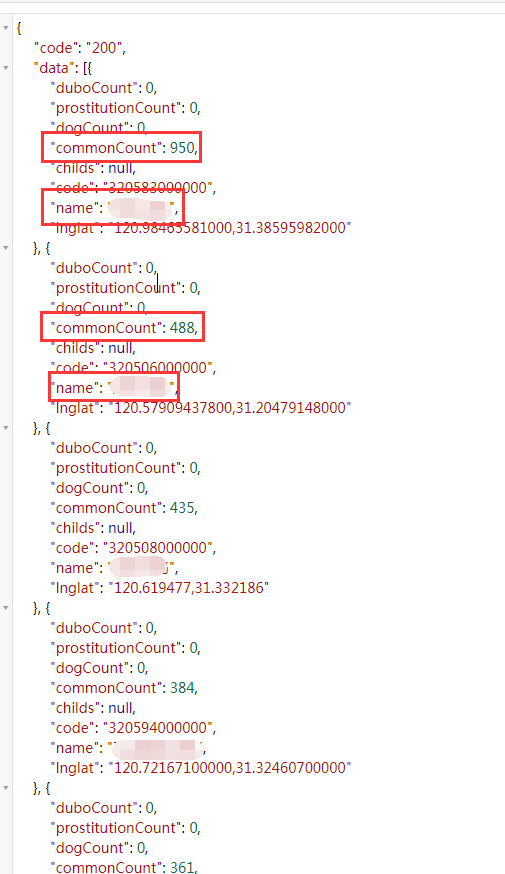
2.把这个数组遍历一下,把要取的name和commonCount放到两个空数组里
这样就取到了
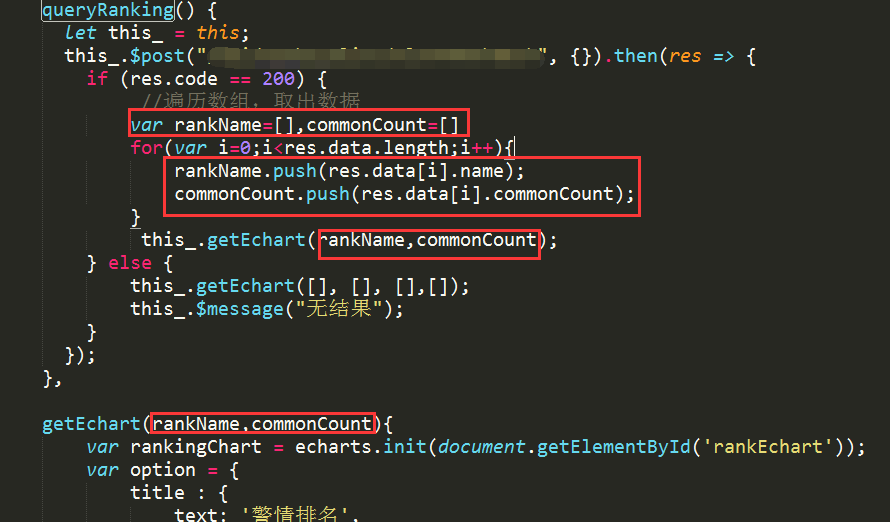
export default {
    name: 'ranking',
    data(){
        return {
        }
    },
    methods:{
        // 工作质态--警情排名
        queryRanking() {
          let this_ = this;
          this_.$post("这里面放接口", {}).then(res => {
            if (res.code == 200) {
                 //遍历数组,取出数据
                var rankName=[],commonCount=[]
                for(var i=0;i<res.data.length;i++){
                    rankName.push(res.data[i].name);
                    commonCount.push(res.data[i].commonCount);
                }
                 this_.getEchart(rankName,commonCount);
            } else {
                this_.getEchart([], [], [],[]);
                this_.$message("无结果");
            }
          });
        },

        getEchart(rankName,commonCount){
            var rankingChart = echarts.init(document.getElementById('rankEchart'));
            var option = {
                title : {
                    text: '警情排名',
                    left:'7%',
                    top:'-1%',
                    textStyle:{
                        //文字颜色
                        color:'#00eeff',
                        //字体大小
                     fontSize:19,
                         fontWeight:'normal',
                    }
                },

                color: ['#3398DB'],
                tooltip: {
                    trigger: 'axis',
                    axisPointer: { // 坐标轴指示器,坐标轴触发有效
                        type: 'shadow' // 默认为直线,可选为:'line' | 'shadow'
                    }
                },
                grid: {
                    top: '12%',
                    left: '10%',
                    right: '15%',
                    bottom: '0',
                    containLabel: true
                },
                yAxis: [{
                    type: 'category',
                    data: rankName ,
                    axisLine: {
                        show: false,
                        lineStyle: {
                            color: '#00eeff'
                        }
                    },
                    axisTick: {
                        show: false
                    },
                    axisLabel: {
                        color:'#ccc',
                        fontSize:15
                    },
                }],
                xAxis: [{
                    show: false,
                    type: 'value'
                }],
                series: [{
                    name: '总计',
                    type: 'bar',
                    barWidth: '18%',
                    // barCategoryGap:10,
                    data: commonCount,
                    itemStyle: {
                        normal: {
                            color: '#00eeff' ,
                            label: {
                                show: true, //开启显示
                                position: ['220px','-1px'], //在上方显示
                                textStyle: { //数值样式
                                          color: '#00eeff',
                                    fontSize: 15
                                }
                            }
                        }
                    },
                }]
            };
            // 为echarts对象加载数据
            rankingChart.setOption(option);
        }

    },
    mounted() {
        // this.getEchart();
        this.queryRanking();
    }

}