
【研发过程质量分析可视化】【页面效果加强版】pandas预处理数据+pyechars数据可视化+研发缺陷质量分析
背景
之前做了一次项目过程质量分析可视化的功课,但是存在2个大问题:
1、画出的图太丑了,只适合一个个截图放在测试报告中用,不适合直接整个html对外展示;
2、画图部分的代码写的比较死,一个图只允许传1个dataFrame进去,不灵活;
因此本次主要:
1、优化html的显示样式,将最终的html有脸直接对外展示;
2、重构画图的代码;
3、将导入excel分为处理所有数据和只处理本月数据两种,方便后续画图时直接调用;
之前的内容可参考:
- 【研发过程质量分析可视化】需求文档 (链接:https://www.cnblogs.com/chooperman/p/14637988.html)
- 【研发过程质量分析可视化】需求1(获取待分析缺陷清单)实现 (链接:https://www.cnblogs.com/chooperman/p/14638213.html)
- 【研发过程质量分析可视化】剩余需求实现(数据处理、数据可视化)(链接:https://www.cnblogs.com/chooperman/p/14679806.html)
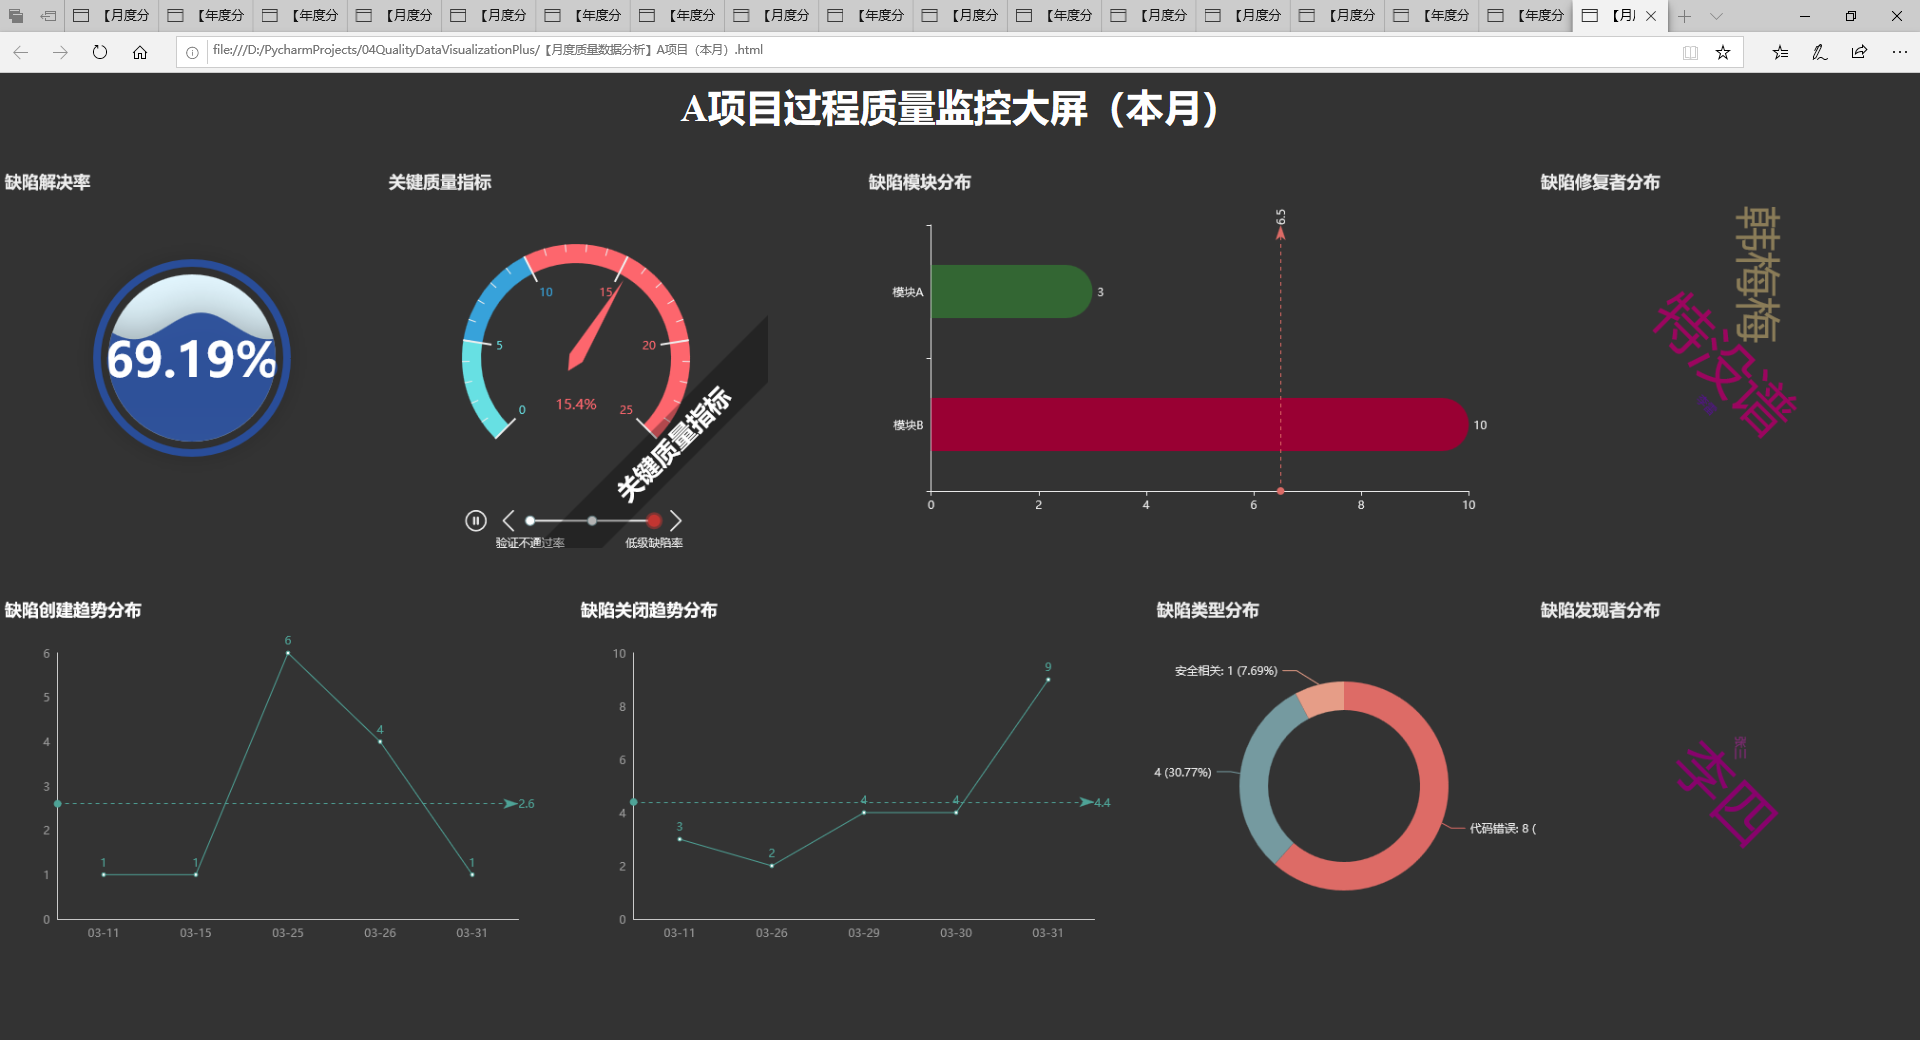
最终效果
最终按照统计本月数据和统计全部数据做了两个表,虽然还是没有美的设计,但是比之前好看多了o(* ̄︶ ̄*)o

实现代码
记得先下载好pandas、pyechars等本次必要的第三方库
代码架构
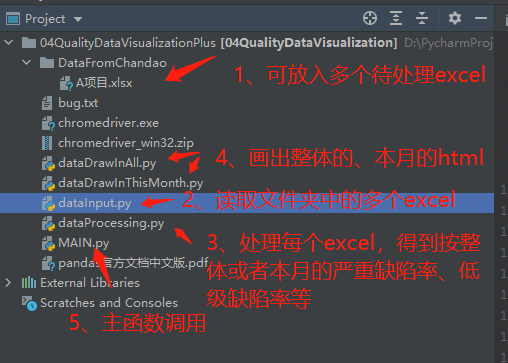
本次分别在dataDrawInAll、dataDrawInThisMonth中画出整体的、本月的可视化大屏,样式什么的均分别定义,增强灵活性;
各模块代码
dataInput:读取文件夹中的各个待分析excel


# -*-coding:utf-8 -*-
import pandas as pd
import os


def getDataFromChandaoForALL():
    """
    从禅道获取excel数据,注意要手动把文件改成excel的xlsx格式,这里返回整个excel数据
    :return:经pandas转换的待处理excel
    """

    dflist = []
    proname = []
    path = 'DataFromChandao'
    for excel in os.listdir(path):
        name, ext = os.path.splitext(excel)   # 将文件夹下的每个excel的名称和扩展名拆分出来,后面生成html时用到这里的文件名
        df = pd.read_excel(os.path.join(path, excel))  # 读取本次要操作的原始数据,即从禅道导出的遗留问题清单
        dflist.append(df)
        proname.append(name)
        pass

    result = {
        'dfList': dflist,
        'proName': proname
    }
    # print(result)
    return result
dataProcessing.py:细化处理,得到每个excel整体的、本月的缺陷解决率、低级缺陷率、严重缺陷率等等,供有需要的地方调用
# -*-coding:GBK -*-
import pandas as pd
import datetime

nowMonth = int(datetime.datetime.now().month)   #注意转成int

class DataProcessingInChandao:
    """
    该类,仅给禅道导出的缺陷使用.代码中的汉字为导出禅道清单中的关键列标题。
    """

    def __init__(self, dataframe):

        self.df = dataframe

        # 本月数据
        self.bugStatusCountsInThisMonth = self.getnumCounts('Bug状态', '本月')  # 缺陷关闭情况分析
        self.bugResolutionRateInThisMonth = self.getRate(self.bugStatusCountsInThisMonth, '缺陷解决率')  # 缺陷解决率
        self.unresolvedBugListInThisMonth = self.getbuglist('未关闭缺陷', '本月')  # 未关闭缺陷列表
        self.severityCountsInThisMonth = self.getnumCounts('严重程度', '本月')  # 严重缺陷分析
        self.severityBugProportionInThisMonth = self.getRate(self.severityCountsInThisMonth, '严重缺陷率')  # 严重缺陷率
        self.severityBugListInThisMonth = self.getbuglist('严重缺陷', '本月')  # 严重缺陷列表
        self.checkNoPassCountsInThisMonth = self.getcheckNoPassCounts('本月')  # 验证不通过缺陷分析
        self.checkNoPassBugProportionInThisMonth = self.getRate(self.checkNoPassCountsInThisMonth, '验证不通过率')  # 验证不通过率
        self.checkNoPassBugListInThisMonth = self.getbuglist('验证不通过缺陷', '本月')  # 验证不通过缺陷列表
        self.lowLevelBugCountsInThisMonth = self.getlowLevelBugCounts('本月')  # 低级缺陷分析
        self.lowLevelBugProportionInThisMonth = self.getRate(self.lowLevelBugCountsInThisMonth, '低级缺陷率')  # 低级缺陷率
        self.lowLevelBugListInThisMonth = self.getbuglist('低级缺陷', '本月')  # 低级缺陷列表
        self.moduleCountsInThisMonth = self.getnumCounts('所属模块', '本月')  # 缺陷按模块分析
        self.bugTypeCountsInThisMonth = self.getnumCounts('Bug类型', '本月')  # 缺陷按类型分析
        self.bugFixerCountsInThisMonth = self.getnumCounts('解决者', '本月')  # 缺陷创建/解决者分析
        self.bugFinderCountsInThisMonth = self.getnumCounts('由谁创建', '本月')  # 缺陷发现者分析
        self.bugCreatTrendByDayInThisMonth = self.getTrendInCreatByDay('本月')  # 每日新增缺陷数
        self.bugCloseTrendByDayInThisMonth = self.getTrendInCloseByDay('本月')  # 每日解决缺陷数
        # print(self.bugStatusCountsInThisMonth)
        # print(self.bugResolutionRateInThisMonth)
        # print(self.unresolvedBugListInThisMonth)
        # print(self.severityCountsInThisMonth)
        # print(self.severityBugProportionInThisMonth)
        # print(self.severityBugListInThisMonth)
        # print(self.checkNoPassCountsInThisMonth)
        # print(self.checkNoPassBugProportionInThisMonth)
        # print(self.checkNoPassBugListInThisMonth)
        # print(self.lowLevelBugCountsInThisMonth)
        # print(self.lowLevelBugProportionInThisMonth)
        # print(self.lowLevelBugListInThisMonth)
        # print(self.moduleCountsInThisMonth)
        # print(self.bugTypeCountsInThisMonth)
        # print(self.bugFixerCountsInThisMonth)
        # print(self.bugFinderCountsInThisMonth)
        # print(self.bugCreatTrendByDayInThisMonth)
        # print(self.bugCloseTrendByDayInThisMonth)

        # 年度累计数据(即根据导出的excel,分析所有的数据,不拆分月份)
        self.bugStatusCountsInAll = self.getnumCounts('Bug状态', '全部')  # 缺陷关闭情况分析
        self.bugResolutionRateInAll = self.getRate(self.bugStatusCountsInAll, '缺陷解决率')  # 缺陷解决率
        self.unresolvedBugListInAll = self.getbuglist('未关闭缺陷', '全部')  # 未关闭缺陷列表
        self.severityCountsInAll = self.getnumCounts('严重程度', '全部')  # 严重缺陷分析
        self.severityBugProportionInAll = self.getRate(self.severityCountsInAll, '严重缺陷率')  # 严重缺陷率
        self.severityBugListInAll = self.getbuglist('严重缺陷', '全部')  # 严重缺陷列表
        self.checkNoPassCountsInAll = self.getcheckNoPassCounts('全部')  # 验证不通过缺陷分析
        self.checkNoPassBugProportionInAll = self.getRate(self.checkNoPassCountsInAll, '验证不通过率')  # 验证不通过率
        self.checkNoPassBugListInAll = self.getbuglist('验证不通过缺陷', '全部')  # 验证不通过缺陷列表
        self.lowLevelBugCountsInAll = self.getlowLevelBugCounts('全部')    # 低级缺陷分析
        self.lowLevelBugProportionInAll = self.getRate(self.lowLevelBugCountsInAll, '低级缺陷率')  # 低级缺陷率
        self.lowLevelBugListInAll = self.getbuglist('低级缺陷', '全部')  # 低级缺陷列表
        self.moduleCountsInAll = self.getnumCounts('所属模块', '全部')    # 缺陷按模块分析
        self.bugTypeCountsInAll = self.getnumCounts('Bug类型', '全部')   # 缺陷按类型分析
        self.bugFixerCountsInAll = self.getnumCounts('解决者', '全部')    # 缺陷创建/解决者分析
        self.bugFinderCountsInAll = self.getnumCounts('由谁创建', '全部')   # 缺陷发现者分析
        self.bugCreatTrendByDayInAll = self.getTrendInCreatByDay('全部')    # 每日新增缺陷数
        self.bugCloseTrendByDayInAll = self.getTrendInCloseByDay('全部')   # 每日解决缺陷数
        self.bugCreatTrendByMonthInAll = self.getTrendInCreatByMonth()  # 本年每月新增缺陷数
        self.bugCloseTrendByMonthInAll = self.getTrendInCloseByMonth()  # 本年每月解决缺陷数
        # print('~~~~~~~~~~~~~~~~~~~~~~~~~~~~~~~~~~~~~~~~~~~~~~~~~~~~~~~~~~~~~~~~~~~~~~~~~~~~~~~~~~~~~~~~')
        # print(self.bugStatusCountsInAll)
        # print(self.bugResolutionRateInAll)
        # print(self.unresolvedBugListInAll)
        # print(self.severityCountsInAll)
        # print(self.severityBugListInAll)
        # print(self.severityBugListInAll)
        # print(self.checkNoPassCountsInAll)
        # print(self.checkNoPassBugProportionInAll)
        # print(self.checkNoPassBugListInAll)
        # print(self.lowLevelBugCountsInAll)
        # print(self.lowLevelBugProportionInAll)
        # print(self.lowLevelBugListInAll)
        # print(self.moduleCountsInAll)
        # print(self.bugTypeCountsInAll)
        # print(self.bugFixerCountsInAll)
        # print(self.bugFinderCountsInAll)
        # print(self.bugCreatTrendByDayInAll)
        # print(self.bugCloseTrendByDayInAll)
        # print(self.bugCreatTrendByMonthInAll)
        # print(self.bugCloseTrendByMonthInAll)

    # 计算比率,不用额外区分是计算本月还是年度,由传入的dataFrame决定
    @staticmethod
    def getRate(dataFrame, types):
        x = dataFrame['数量'].sum()
        y = 0
        if types == '缺陷解决率':
            y = dataFrame.loc[dataFrame['Bug状态'].isin(['已关闭']), '数量'].sum()
        elif types == '严重缺陷率':
            y = dataFrame.loc[dataFrame['严重程度'].isin(['严重', '重要']), '数量'].sum()
        elif types == '验证不通过率':
            y = dataFrame.loc[dataFrame['验证情况'].isin(['验证不通过']), '数量'].sum()
        elif types == '低级缺陷率':
            y = dataFrame.loc[dataFrame['低级缺陷情况'].isin(['低级缺陷']), '数量'].sum()
        result = round(y/x, 3)  # 保留小数点后3位
        return result

    # 获取指定缺陷清单,需要传入统计周期参数statPeriod
    def getbuglist(self, listType, statPeriod):
        df_tmp = None
        Counts = None
        if statPeriod == '本月':
            df_tmp = self.df[self.df['创建日期'].dt.month == nowMonth]  # 过滤创建日期为本月的数据
        elif statPeriod == '全部':
            df_tmp = self.df   # 全部数据
        if listType == '严重缺陷':
            Counts = df_tmp.loc[df_tmp['严重程度'].isin(['严重', '重要']), ['Bug编号', 'Bug标题', '严重程度', 'Bug状态']]
        elif listType == '低级缺陷':
            # 统计低级缺陷个数,即BUG标题中含有【低级缺陷】的个数,先过滤一遍
            Counts = df_tmp.loc[df_tmp['Bug标题'].str.contains('【低级缺陷】'), ['Bug编号', 'Bug标题', '解决者', 'Bug状态']]
        elif listType == '验证不通过缺陷':
            Counts = df_tmp.loc[df_tmp['激活次数'] > 0, ['Bug编号', 'Bug标题', '指派给', 'Bug状态']]
        elif listType == '未关闭缺陷':
            # 只统计严重以上缺陷
            # Counts = self.df.loc[
            # (self.df['Bug状态'].isin(['已解决', '激活']))&(self.df['严重程度'].isin(['严重','重要'])),
            # ['Bug编号', 'Bug标题', '严重程度', 'Bug状态']]
            Counts = df_tmp.loc[df_tmp['Bug状态'].isin(['已解决', '激活']), ['Bug编号', 'Bug标题', '严重程度', 'Bug状态']]   # 这个统计全部遗留缺陷
        return Counts

    # 获取指定维度统计数量,需要传入统计周期参数statPeriod
    def getnumCounts(self, columnsName, statPeriod):
        df_tmp = None
        if statPeriod == '本月':
            df_tmp = self.df[self.df['创建日期'].dt.month == nowMonth]  # 过滤创建日期为本月的数据
        elif statPeriod == '全部':
            df_tmp = self.df
        df_tmp = df_tmp.groupby(columnsName, as_index=False).apply(len)  # 按模块分类后,获取每个模块的数量(即长度)
        df_tmp.columns = [columnsName, '数量']   # 上述步骤获取的结果,数量一列列名为NaN,这里重新命名
        Counts = df_tmp.sort_values(by='数量', ascending=False)  # 按照数量进行倒序排序
        return Counts

    # 统计一年中每月总计的缺陷趋势,不会在单月的数据中使用
    def getTrendInCreatByMonth(self):
        df_tmp = self.df
        df_tmp = df_tmp.loc[~df_tmp['创建日期'].isin(['0000-00-00', '']), :]  # 先清洗掉数据中时间为0000-00-00的无效数据
        df_tmp = df_tmp.groupby('创建日期', as_index=False).apply(len)  # 按模块分类后,获取每个模块的数量(即长度)
        df_tmp.columns = ['创建日期', '数量']  # 上述步骤获取的结果,数量一列列名为NaN,这里重新命名
        grouper = pd.Grouper(key='创建日期', freq='M')
        Counts = df_tmp.groupby(grouper).sum().reset_index()
        for i in range(len(Counts)):
            Counts.iloc[i, 0] = Counts.iloc[i, 0].strftime("%m")+'月'   # 将时间转换成月份
        return Counts

    # 统计一年中每月总计的缺陷趋势,不会在单月的数据中使用
    def getTrendInCloseByMonth(self):
        # df_tmp = self.df
        # 先清洗掉数据中时间为0000-00-00,以及没有关闭日期(即空字符串)的的无效数据
        df_tmp = self.df.loc[~(self.df['关闭日期'].isin(['0000-00-00', ''])), :]
        df_tmp = df_tmp.copy()   # 这里要先复制一下,不然下一行转成时间类型,会报错。有木有很神奇的而样子哈哈哈~~~
        df_tmp['关闭日期'] = pd.to_datetime(df_tmp['关闭日期'])    # 由于关闭日期不是默认datatime类型,这里要先转换一下
        df_tmp = df_tmp.groupby('关闭日期', as_index=False).apply(len)  # 按模块分类后,获取每个模块的数量(即长度)
        df_tmp.columns = ['关闭日期', '数量']  # 上述步骤获取的结果,数量一列列名为NaN,这里重新命名
        grouper = pd.Grouper(key='关闭日期', freq='M')
        Counts = df_tmp.groupby(grouper).sum().reset_index()
        for i in range(len(Counts)):
            Counts.iloc[i, 0] = Counts.iloc[i, 0].strftime("%m")+'月'   # 将时间转换成月份
        return Counts

    # 获取维度缺陷按日新增趋势,需要传入统计周期参数statPeriod
    def getTrendInCreatByDay(self, statPeriod):
        df_tmp = None
        if statPeriod == '本月':
            df_tmp = self.df[self.df['创建日期'].dt.month == nowMonth]  # 过滤创建日期为本月的数据  这里算的是本月新增缺陷中被关闭的,略微不准
        elif statPeriod == '全部':
            df_tmp = self.df
        df_tmp = df_tmp.loc[~df_tmp['创建日期'].isin(['0000-00-00', '']), :]  # 先清洗掉数据中时间为0000-00-00的无效数据
        df_tmp = df_tmp.groupby('创建日期', as_index=False).apply(len)  # 按模块分类后,获取每个模块的数量(即长度)
        df_tmp.columns = ['创建日期', '数量']   # 上述步骤获取的结果,数量一列列名为NaN,这里重新命名
        Counts = df_tmp.sort_index(ascending=True)  # 倒序排序
        for i in range(len(Counts)):
            Counts.iloc[i, 0] = Counts.iloc[i, 0].strftime("%m-%d")   # 将时间转换成月-日格式字符串
        return Counts

    # 获取维度缺陷按日关闭趋势,需要传入统计周期参数statPeriod
    def getTrendInCloseByDay(self, statPeriod):
        # 先清洗掉数据中时间为0000-00-00,以及没有关闭日期(即空字符串)的的无效数据
        df_tmp = self.df.loc[~(self.df['关闭日期'].isin(['0000-00-00', ''])), :]
        df_tmp = df_tmp.copy()   # 这里要先复制一下,不然下一行转成时间类型,会报错。有木有很神奇的而样子哈哈哈~~~
        df_tmp['关闭日期'] = pd.to_datetime(df_tmp['关闭日期'])    # 由于关闭日期不是默认datatime类型,这里要先转换一下
        if statPeriod == '本月':
            df_tmp = df_tmp[df_tmp['关闭日期'].dt.month == nowMonth]  # 过滤关闭日期为本月的数据  这里算的是本月关闭的缺陷,也可能包含上个月创建但本月关闭的缺陷
        elif statPeriod == '全部':
            df_tmp = df_tmp

        df_tmp = df_tmp.groupby('关闭日期', as_index=False).apply(len)  # 按模块分类后,获取每个模块的数量(即长度)
        df_tmp.columns = ['关闭日期', '数量']   # 上述步骤获取的结果,数量一列列名为NaN,这里重新命名
        Counts = df_tmp.sort_index(ascending=True)  # 倒序排序
        for i in range(len(Counts)):
            Counts.iloc[i, 0] = Counts.iloc[i, 0].strftime("%m-%d")   # 将时间转换成月-日格式字符串
        return Counts

    # 获取验证不通过统计情况,需要传入统计周期参数statPeriod
    def getcheckNoPassCounts(self, statPeriod):
        df_tmp = None
        if statPeriod == '本月':
            df_tmp = self.df[self.df['创建日期'].dt.month == nowMonth]  # 过滤创建日期为本月的数据
        elif statPeriod == '全部':
            df_tmp = self.df
        checkNoPass = len(df_tmp.loc[df_tmp['激活次数'] > 0, :])   # 激活次数大于0,表示问题验证不通过
        # 实际,验证的缺陷次数=关闭状态的缺陷+激活/已解决状态下激活次数大于0的缺陷数
        checkPassCondition = (df_tmp['Bug状态'].isin(['已关闭'])) | ((~df_tmp['Bug状态'].isin(['已关闭'])) & (df_tmp['激活次数'] > 0))
        checkPass = len(df_tmp.loc[checkPassCondition, :])
        Counts = pd.DataFrame({'验证情况': ['验证不通过', '验证通过'], '数量': [checkNoPass, checkPass]})
        return Counts

    # 获取低级缺陷统计情况,需要传入统计周期参数statPeriod
    def getlowLevelBugCounts(self, statPeriod):
        df_tmp = None
        if statPeriod == '本月':
            df_tmp = self.df[self.df['创建日期'].dt.month == nowMonth]  # 过滤创建日期为本月的数据
        elif statPeriod == '全部':
            df_tmp = self.df
        # 统计低级缺陷个数,即BUG标题中含有【低级缺陷】的个数,先过滤一遍
        lowLevelBugCount = len(df_tmp.loc[df_tmp['Bug标题'].str.contains('【低级缺陷】'), :])
        highLevelBugCount = len(df_tmp) - lowLevelBugCount  # 非低级缺陷=总缺陷数-低级缺陷数
        Counts = pd.DataFrame({'低级缺陷情况': ['低级缺陷', '非低级缺陷'], '数量': [lowLevelBugCount, highLevelBugCount]})
        return Counts
dataDrawInAll.py:调用业务上想要的各分析维度的数据,画出累计的分析图(即一次分析出excel中存在的所有数据)
# -*-coding:GBK -*-
from bs4 import BeautifulSoup
import dataProcessing
from pyecharts.charts import Bar, Pie, Line, WordCloud, Liquid, Gauge, Timeline, Page
from pyecharts.commons.utils import JsCode
from pyecharts.globals import ThemeType
from pyecharts import options as opts


class DataRenderHtml:
    def __init__(self, dataframe, proName):
        # 实例化获取待分析缺陷清单各个维度的dataFrame
        self.df = dataProcessing.DataProcessingInChandao(dataframe)
        self.proName = proName   # 禅道的excel名称,用于给生成的HTML命名
        self.creatHtml()

    # 缺陷模块分布(累计),已柱状图显示
    def bugModuleOnBar(self):
        # 需要画图的dataFrame
        df_tmp = self.df.moduleCountsInAll   # 缺陷模块分布(累计)
        # 定义柱状图变量
        bar = Bar(init_opts=opts.InitOpts(theme=ThemeType.WONDERLAND))
        # 定义柱状图X轴
        bar.add_xaxis(df_tmp.iloc[:, 0].tolist())   # 第一列的所有行,即模块名称
        # 定义柱状图Y轴
        bar.add_yaxis('缺陷量', df_tmp.iloc[:, 1].tolist(), category_gap="60%")    # 第二列的所有行,即模块名称对应的缺陷数量
        # 定义图标全局变量,定义图标主标题和副标题
        bar.set_global_opts(
            title_opts=opts.TitleOpts(
                title="缺陷模块分布",
                title_textstyle_opts=opts.TextStyleOpts(color="#FFFFFF"),  # 定义图表主标题
            ),
            legend_opts=opts.LegendOpts(is_show=False)  # 定义图表的图例位置
        )
        bar.reversal_axis()  # 反转X/Y轴
        bar.set_series_opts(
            # label_opts=opts.LabelOpts(is_show=False),   # 这个用于取消柱状图上方的数字标签
            label_opts=opts.LabelOpts(position="right"),
            markline_opts=opts.MarkLineOpts(
                data=[
                    # opts.MarkLineItem(type_="min", name="最小值"),
                    # opts.MarkLineItem(type_="max", name="最大值"),
                    opts.MarkLineItem(type_="average", name="平均值"),
                ]
            ),
        )
        return bar

    # 缺陷解决率(累计),已水球图显示
    def bugResolutionOnLiquid(self):
        # 需要画图的dataFrame
        df_tmp = self.df.bugResolutionRateInAll  # 缺陷解决率(累计)
        liquid = Liquid(init_opts=opts.InitOpts(theme=ThemeType.WONDERLAND))
        liquid.add(
            '缺陷解决率',
            [df_tmp],
            is_outline_show=False,
            label_opts=opts.LabelOpts(
                font_size=50,
                formatter=JsCode(
                    """function (param) {
                        return (Math.floor(param.value * 10000) / 100) + '%';
                    }"""
                ),
                position="inside",
            ),
        )
        # 定义图标全局变量,定义图标主标题和副标题
        liquid.set_global_opts(
            title_opts=opts.TitleOpts(
                title='缺陷解决率',
                title_textstyle_opts=opts.TextStyleOpts(color="#FFFFFF"),  # 定义图表主标题
            ),  # 定义图表主标题

        )
        return liquid

    # 关键质量指标(累计),已仪表盘显示
    def kpiOnTimeLine(self):
        typeList = ['验证不通过率', '严重缺陷率', '低级缺陷率']
        rate = [
            self.df.checkNoPassBugProportionInAll,
            self.df.severityBugProportionInAll,
            self.df.lowLevelBugProportionInAll
        ]
        timeline = Timeline(init_opts=opts.InitOpts(theme=ThemeType.WONDERLAND))  # 增加自动播放,设置主题
        for typeList, rate in zip(typeList, rate):
            gauge = Gauge(init_opts=opts.InitOpts(theme=ThemeType.WONDERLAND))
            gauge.add(
                series_name='',
                data_pair=[(type, round(rate * 100, 1))],
                min_=0,
                max_=25,  # 仪表盘最大显示的数字大小,根据业务情况自己设置
                split_number=5,  # 分割次数,即max除去split_number得到仪表盘拆分成几等份
                radius="60%",        # 仪表盘的大小显示,太大了比较丑
                axisline_opts=opts.AxisLineOpts(
                    linestyle_opts=opts.LineStyleOpts(
                        color=[(1 / 5, "#91C7AE"), (2 / 5, "#63869E"), (1, "#C23531")], width=20   # 设置仪表盘中不同颜色及颜色显示的占比
                        # color=[(1 / 5,), (2 / 5,), (1,)], width=20  # 设置仪表盘中不同颜色及颜色显示的占比
                    )),
                title_label_opts=opts.LabelOpts(
                    font_size=15,  # 设置仪表盘内文字的大小
                ),
                detail_label_opts=opts.LabelOpts(
                    # 设置百分比数字的大小,必须设置大一点,否则显示上和标题重合
                    font_size=15,
                    # 上面设置了百分比数字的大小,这里必须设置这参数,否则数值不显示百分号
                    formatter="{value}%"
                ),
            )
            # 定义图标全局变量,定义图标主标题和副标题
            gauge.set_global_opts(
                title_opts=opts.TitleOpts(
                    title='关键质量指标',
                    title_textstyle_opts=opts.TextStyleOpts(color="#FFFFFF"),  # 定义图表主标题
                    ),  # 定义图表主标题
                graphic_opts=[
                    opts.GraphicGroup(
                        graphic_item=opts.GraphicItem(
                            rotation=JsCode("Math.PI / 4"),
                            bounding="raw",
                            right=100,
                            bottom=110,
                            z=100,
                        ),
                        children=[
                            opts.GraphicRect(
                                graphic_item=opts.GraphicItem(
                                    left="center", top="center", z=100
                                ),
                                graphic_shape_opts=opts.GraphicShapeOpts(
                                    width=400, height=50
                                ),
                                graphic_basicstyle_opts=opts.GraphicBasicStyleOpts(
                                    fill="rgba(0,0,0,0.3)"
                                ),
                            ),
                            opts.GraphicText(
                                graphic_item=opts.GraphicItem(
                                    left="center", top="center", z=100
                                ),
                                graphic_textstyle_opts=opts.GraphicTextStyleOpts(
                                    text="关键质量指标",
                                    font="bold 26px Microsoft YaHei",
                                    graphic_basicstyle_opts=opts.GraphicBasicStyleOpts(
                                        fill="#fff"
                                    ),
                                ),
                            ),
                        ],
                    )
                ],
            )
            timeline.add(gauge, typeList)
            timeline.add_schema(is_auto_play=True)  # 自动播放
        return timeline

    # 缺陷类型分布(累计),已圆环图显示
    def bugTypeOnPie(self):
        # 需要画图的dataFrame
        df_tmp = self.df.bugTypeCountsInAll  # 缺陷类型分布(累计)
        # 定义饼图
        pie = Pie(init_opts=opts.InitOpts(theme=ThemeType.WONDERLAND))
        # 生成饼图所需列表数据
        data_pair = [list(z) for z in zip(df_tmp.iloc[:, 0].tolist(), df_tmp.iloc[:, 1].tolist())]  # 缺陷类型名称、对应名称下的数据
        # 给饼图增加数据
        pie.add(
            '',
            data_pair,
            # radius="60%",
            radius=["40%", "55%"],

        )
        # 定义图标全局变量,定义图标主标题和副标题
        pie.set_global_opts(
            legend_opts=opts.LegendOpts(is_show=False),
            title_opts=opts.TitleOpts(
                title="缺陷类型分布",
                title_textstyle_opts=opts.TextStyleOpts(color="#FFFFFF"),  # 定义图表主标题
             ),  # 定义图表主标题
            # legend_opts=opts.LegendOpts(type_="scroll", pos_left="right", orient="vertical")  # 定义图表的图例位置
        )
        # 定义系列数据显示格式,自定义显示格式(b:name, c:value, d:百分比)
        pie.set_series_opts(label_opts=opts.LabelOpts(formatter="{b}: {c} ({d}%)", is_show=True))
        return pie

    # 缺陷修复者分布(累计),已词云图显示
    def bugFixerOnCloud(self):
        # 需要画图的dataFrame
        df_tmp = self.df.bugFixerCountsInAll  # 缺陷修复者分布(累计)
        # 定义词云图变量
        cloud = WordCloud(init_opts=opts.InitOpts(theme=ThemeType.WONDERLAND))
        # 生成词云图所需列表数据
        data_pair = [list(z) for z in zip(df_tmp.iloc[:, 0].tolist(), df_tmp.iloc[:, 1].tolist())]
        # 定义词云参数
        cloud.add('', data_pair, is_draw_out_of_bound=True)
        # 定义图标全局变量,定义图标主标题和副标题
        cloud.set_global_opts(
            title_opts=opts.TitleOpts(
                title='缺陷修复者分布',
                title_textstyle_opts=opts.TextStyleOpts(color="#FFFFFF"),  # 定义图表主标题
             ),  # 定义图表主标题
        )
        return cloud

    # 缺陷发现分布(累计),已词云图显示
    def bugFinderOnCloud(self):
        # 需要画图的dataFrame
        df_tmp = self.df.bugFinderCountsInAll  # 缺陷发现者分布(累计)
        # 定义词云图变量
        cloud = WordCloud(init_opts=opts.InitOpts(theme=ThemeType.WONDERLAND))
        # 生成词云图所需列表数据
        data_pair = [list(z) for z in zip(df_tmp.iloc[:, 0].tolist(), df_tmp.iloc[:, 1].tolist())]
        # 定义词云参数
        cloud.add('', data_pair, is_draw_out_of_bound=True)
        # 定义图标全局变量,定义图标主标题和副标题
        cloud.set_global_opts(
            title_opts=opts.TitleOpts(
                title='缺陷发现者分布',
                title_textstyle_opts=opts.TextStyleOpts(color="#FFFFFF"),  # 定义图表主标题
            ),  # 定义图表主标题
        )
        return cloud

    # 缺陷每日新增趋势分布(累计),已柱状图显示
    def bugTrendByDayOnBar(self):
        # 需要画图的dataFrame
        df_tmp = self.df.bugCreatTrendByDayInAll  # 缺陷每日新增趋势分布(累计)
        # 定义柱状图变量
        bar = Bar(init_opts=opts.InitOpts(theme=ThemeType.WONDERLAND))
        # 定义柱状图X轴
        bar.add_xaxis(df_tmp.iloc[:, 0].tolist())
        # 定义柱状图Y轴
        bar.add_yaxis('缺陷量', df_tmp.iloc[:, 1].tolist(), category_gap="60%")
        # 定义图标全局变量,定义图标主标题和副标题
        bar.set_global_opts(
            title_opts=opts.TitleOpts(
                title="缺陷每日新增趋势分布",
                title_textstyle_opts=opts.TextStyleOpts(color="#FFFFFF"),  # 定义图表主标题
            ),  # 定义图表主标题
            legend_opts=opts.LegendOpts(is_show=False),  # 定义图表的图例位置
            datazoom_opts=[opts.DataZoomOpts(), opts.DataZoomOpts(type_="inside")],
        )
        return bar

    # 缺陷每月趋势分布(累计),已折线图显示
    def bugTrendByMonthOnline(self):
        # 需要画图的dataFrame
        df_tmp1 = self.df.bugCreatTrendByMonthInAll  # 缺陷每月趋势分布(累计)
        df_tmp2 = self.df.bugCloseTrendByMonthInAll  # 缺陷每月趋势分布(累计)
        # 定义折现图变量
        line = Line(init_opts=opts.InitOpts(theme=ThemeType.WONDERLAND))
        # 定义折线图X轴
        line.add_xaxis(df_tmp1.iloc[:, 0].tolist())  # 姑且认为每月都会有新增、减少bug,大家共用1个X轴
        # 定义柱状图Y轴
        line.add_yaxis('新增缺陷', df_tmp1.iloc[:, 1].tolist(), is_smooth=True,
                       markline_opts=opts.MarkLineOpts(data=[opts.MarkLineItem(type_="average")]))
        line.add_yaxis('关闭缺陷', df_tmp2.iloc[:, 1].tolist(), is_smooth=True,
                       markline_opts=opts.MarkLineOpts(data=[opts.MarkLineItem(type_="average")]))
        # 定义图标全局变量
        line.set_global_opts(
            title_opts=opts.TitleOpts(
                title='缺陷趋势分布',
                title_textstyle_opts=opts.TextStyleOpts(color="#FFFFFF"),  # 定义图表主标题
            ),  # 定义图表主标题
            legend_opts=opts.LegendOpts(is_show=False)  # 定义图表的图例位置
        )
        line.set_series_opts(
            areastyle_opts=opts.AreaStyleOpts(opacity=0.5),
            label_opts=opts.LabelOpts(is_show=True, color='auto'),   # 显示数字标签
        )
        return line

    def creatHtml(self):
        # 待绘制的图
        char = [
            self.bugTrendByDayOnBar(),      # 缺陷新增趋势(每日)
            self.bugResolutionOnLiquid(),   # 缺陷解决率(累计)
            self.bugModuleOnBar(),          # 缺陷模块分布(累计)
            self.bugTrendByMonthOnline(),   # 缺陷趋势分布(每月)
            self.bugTypeOnPie(),            # 缺陷类型分布(累计)
            self.kpiOnTimeLine(),           # 关键质量指标(本月)
            self.bugFixerOnCloud(),         # 缺陷修复者分布(累计)
            self.bugFinderOnCloud(),        # 缺陷发现者分布(累计)
        ]
        page = Page(layout=Page.SimplePageLayout, page_title='【年度分析】'+self.proName)
        for i in char:
            page.add(i)
        page.render(
            path='【年度质量数据分析】'+self.proName + '(累计).html',
        )

        with open('【年度质量数据分析】'+self.proName + '(累计).html', "r+", encoding='utf-8') as html:
            html_bf = BeautifulSoup(html, 'lxml')
            div_title = "<div align=\"center\">\n<span style=\"font-size:40px;font face=\'黑体\';color:#FFFFFF\"><b>"+self.proName+"过程质量监控大屏(累计)</b></div>"
            divs = html_bf.select('.chart-container')
            divs[0][
                'style'] = "width:40%;height:400px;position:absolute;top:100px;left:0px;border-style:solid;border-color:#444444;border-width:0px;"
            divs[1][
                "style"] = "width:20%;height:400px;position:absolute;top:100px;left:40%;border-style:solid;border-color:#444444;border-width:0px;"
            divs[2][
                "style"] = "width:40%;height:400px;position:absolute;top:100px;left:60%;border-style:solid;border-color:#444444;border-width:0px;"
            divs[3][
                "style"] = "width:25%;height:400px;position:absolute;top:550px;left:0px;border-style:solid;border-color:#444444;border-width:0px;"

            divs[4][
                "style"] = "width:25%;height:400px;position:absolute;top:550px;left:25%;border-style:solid;border-color:#444444;border-width:0px;"
            divs[5][
                "style"] = "width:25%;height:400px;position:absolute;top:550px;left:50%;border-style:solid;border-color:#444444;border-width:0px;"
            divs[6][
                "style"] = "width:25%;height:200px;position:absolute;top:550px;left:75%;border-style:solid;border-color:#444444;border-width:0px;"
            divs[7][
                "style"] = "width:25%;height:200px;position:absolute;top:750px;left:75%;border-style:solid;border-color:#444444;border-width:0px;"

            body = html_bf.find("body")
            body["style"] = "background-color:#07645D;"
            body.insert(0, BeautifulSoup(div_title, "lxml").div)
            html_new = str(html_bf)
            html.seek(0, 0)
            html.truncate()
            html.write(html_new)
            html.close()

        return page
dataDrawInThisMonth.py:调用业务上想要的各分析维度的数据,画出本月的分析图(即只分析excel中相关时间为本月的数据)
# -*-coding:GBK -*-
from bs4 import BeautifulSoup
import dataProcessing
from pyecharts.charts import Bar, Pie, WordCloud, Line, Liquid, Gauge, Timeline, Page
from pyecharts.commons.utils import JsCode
from pyecharts.globals import ThemeType
from pyecharts import options as opts


class DataRenderHtml:
    def __init__(self, dataframe, proName):
        # 实例化获取待分析缺陷清单各个维度的dataFrame
        self.df = dataProcessing.DataProcessingInChandao(dataframe)
        self.proName = proName   # 禅道的excel名称,用于给生成的HTML命名
        self.creatHtml()

    # 缺陷模块分布(累计),已柱状图显示
    def bugModuleOnBar(self):
        # 需要画图的dataFrame
        df_tmp = self.df.moduleCountsInThisMonth   # 缺陷模块分布(累计)
        mid = str(df_tmp['数量'].mean())  # 需要转成str,不然下面的js代码不能拼接

        # 指定柱状图颜色,缺陷总数超过平均值为红色,否则绿色
        color_function = """
                function (params) {
                    if (params.value > 0 && params.value < """+mid+""") {
                        return '#336633';
                    } else if (params.value > """+mid+""") {
                        return '#990033';
                    }
                }
                """

        # 定义柱状图变量
        bar = Bar(init_opts=opts.InitOpts(theme=ThemeType.DARK))
        # 定义柱状图X轴
        bar.add_xaxis(df_tmp.iloc[:, 0].tolist())   # 第一列的所有行,即模块名称
        # 定义柱状图Y轴
        bar.add_yaxis(
            '缺陷量',
            df_tmp.iloc[:, 1].tolist(),
            category_gap="60%",

        )    # 第二列的所有行,即模块名称对应的缺陷数量
        # 定义图标全局变量,定义图标主标题和副标题
        bar.set_global_opts(
            title_opts=opts.TitleOpts(title="缺陷模块分布"),  # 定义图表主标题
            legend_opts=opts.LegendOpts(is_show=False)  # 定义图表的图例位置
        )
        bar.reversal_axis()  # 反转X/Y轴
        bar.set_series_opts(
            # label_opts=opts.LabelOpts(is_show=False),   # 这个用于取消柱状图上方的数字标签
            label_opts=opts.LabelOpts(position="right"),
            markline_opts=opts.MarkLineOpts(
                data=[
                    # opts.MarkLineItem(type_="min", name="最小值"),
                    # opts.MarkLineItem(type_="max", name="最大值"),
                    opts.MarkLineItem(type_="average", name="平均值"),
                ]
            ),
            itemstyle_opts={
                "normal": {
                    "barBorderRadius": [0, 30, 30, 0],
                    'color': JsCode(color_function),
                }
            }

        )
        return bar

    # 缺陷解决率(累计),已水球图显示
    def bugResolutionOnLiquid(self):
        # 需要画图的dataFrame
        df_tmp = self.df.bugResolutionRateInThisMonth  # 缺陷解决率(累计)
        liquid = Liquid(init_opts=opts.InitOpts(theme=ThemeType.DARK))
        liquid.add(
            '缺陷解决率',
            [df_tmp],
            # is_outline_show=False,

            label_opts=opts.LabelOpts(
                font_size=50,
                formatter=JsCode(
                    """function (param) {
                        return (Math.floor(param.value * 10000) / 100) + '%';
                    }"""
                ),
                position="inside",
            ),
        )
        # 定义图标全局变量,定义图标主标题和副标题
        liquid.set_global_opts(
            title_opts=opts.TitleOpts(title='缺陷解决率'),  # 定义图表主标题
        )
        return liquid

    # 关键质量指标(累计),已仪表盘显示
    def kpiOnTimeLine(self):
        typeList = ['验证不通过率', '严重缺陷率', '低级缺陷率']
        rate = [
            self.df.checkNoPassBugProportionInThisMonth,
            self.df.severityBugProportionInThisMonth,
            self.df.lowLevelBugProportionInThisMonth
        ]
        timeline = Timeline(init_opts=opts.InitOpts(theme=ThemeType.DARK))  # 增加自动播放,设置主题
        for typeList, rate in zip(typeList, rate):
            gauge = Gauge(init_opts=opts.InitOpts(theme=ThemeType.DARK))
            gauge.add(
                series_name='',
                data_pair=[(type, round(rate * 100, 1))],
                min_=0,
                max_=25,  # 仪表盘最大显示的数字大小,根据业务情况自己设置
                split_number=5,  # 分割次数,即max除去split_number得到仪表盘拆分成几等份
                radius="60%",        # 仪表盘的大小显示,太大了比较丑
                axisline_opts=opts.AxisLineOpts(
                    linestyle_opts=opts.LineStyleOpts(
                        # color=[(1 / 5, "#91C7AE"), (2 / 5, "#63869E"), (1, "#C23531")], width=20
                        # 设置仪表盘中不同颜色及颜色显示的占比
                        color=[(1 / 5, "#67e0e3"), (2 / 5, "#37a2da"), (1, "#fd666d")], width=20
                        # color=[(1 / 5,), (2 / 5,), (1,)], width=20  # 设置仪表盘中不同颜色及颜色显示的占比
                    )),
                title_label_opts=opts.LabelOpts(
                    font_size=15,  # 设置仪表盘内文字的大小
                ),
                detail_label_opts=opts.LabelOpts(
                    # 设置百分比数字的大小,必须设置大一点,否则显示上和标题重合
                    font_size=15,
                    # 上面设置了百分比数字的大小,这里必须设置这参数,否则数值不显示百分号
                    formatter="{value}%"
                ),
            )
            # 定义图标全局变量,定义图标主标题和副标题
            gauge.set_global_opts(
                title_opts=opts.TitleOpts(title='关键质量指标'),  # 定义图表主标题
                graphic_opts=[
                    opts.GraphicGroup(
                        graphic_item=opts.GraphicItem(
                            rotation=JsCode("Math.PI / 4"),
                            bounding="raw",
                            right=100,
                            bottom=110,
                            z=100,
                        ),
                        children=[
                            opts.GraphicRect(
                                graphic_item=opts.GraphicItem(
                                    left="center", top="center", z=100
                                ),
                                graphic_shape_opts=opts.GraphicShapeOpts(
                                    width=400, height=50
                                ),
                                graphic_basicstyle_opts=opts.GraphicBasicStyleOpts(
                                    fill="rgba(0,0,0,0.3)"
                                ),
                            ),
                            opts.GraphicText(
                                graphic_item=opts.GraphicItem(
                                    left="center", top="center", z=100
                                ),
                                graphic_textstyle_opts=opts.GraphicTextStyleOpts(
                                    text="关键质量指标",
                                    font="bold 26px Microsoft YaHei",
                                    graphic_basicstyle_opts=opts.GraphicBasicStyleOpts(
                                        fill="#fff"
                                    ),
                                ),
                            ),
                        ],
                    )
                ],
            )
            timeline.add(gauge, typeList)
            timeline.add_schema(is_auto_play=True)  # 自动播放
        return timeline

    # 缺陷类型分布,已圆环图显示
    def bugTypeOnPie(self):
        # 需要画图的dataFrame
        df_tmp = self.df.bugTypeCountsInThisMonth  # 缺陷类型分布
        # 定义饼图
        pie = Pie(init_opts=opts.InitOpts(theme=ThemeType.DARK))
        # 生成饼图所需列表数据
        data_pair = [list(z) for z in zip(df_tmp.iloc[:, 0].tolist(), df_tmp.iloc[:, 1].tolist())]  # 缺陷类型名称、对应名称下的数据
        # 给饼图增加数据
        pie.add(
            '',
            data_pair,
            # radius="60%",
            radius=["40%", "55%"],

        )
        # 定义图标全局变量,定义图标主标题和副标题
        pie.set_global_opts(
            legend_opts=opts.LegendOpts(is_show=False),
            title_opts=opts.TitleOpts(title="缺陷类型分布"),  # 定义图表主标题
            # legend_opts=opts.LegendOpts(type_="scroll", pos_left="right", orient="vertical")  # 定义图表的图例位置
        )
        # 定义系列数据显示格式,自定义显示格式(b:name, c:value, d:百分比)
        pie.set_series_opts(label_opts=opts.LabelOpts(formatter="{b}: {c} ({d}%)", is_show=True))
        return pie

    # 缺陷修复者分布,已词云图显示
    def bugFixerOnCloud(self):
        # 需要画图的dataFrame
        df_tmp = self.df.bugFixerCountsInThisMonth  # 缺陷修复者分布(累计)
        # 定义词云图变量
        cloud = WordCloud(init_opts=opts.InitOpts(theme=ThemeType.DARK))
        # 生成词云图所需列表数据
        data_pair = [list(z) for z in zip(df_tmp.iloc[:, 0].tolist(), df_tmp.iloc[:, 1].tolist())]
        # 定义词云参数
        cloud.add('', data_pair, is_draw_out_of_bound=True)
        # 定义图标全局变量,定义图标主标题和副标题
        cloud.set_global_opts(
            title_opts=opts.TitleOpts(title='缺陷修复者分布'),  # 定义图表主标题
        )
        return cloud

    # 缺陷发现分布,已词云图显示
    def bugFinderOnCloud(self):
        # 需要画图的dataFrame
        df_tmp = self.df.bugFinderCountsInThisMonth  # 缺陷发现者分布
        # 定义词云图变量
        cloud = WordCloud(init_opts=opts.InitOpts(theme=ThemeType.DARK))
        # 生成词云图所需列表数据
        data_pair = [list(z) for z in zip(df_tmp.iloc[:, 0].tolist(), df_tmp.iloc[:, 1].tolist())]
        # 定义词云参数
        cloud.add('', data_pair, is_draw_out_of_bound=True)
        # 定义图标全局变量,定义图标主标题和副标题
        cloud.set_global_opts(
            title_opts=opts.TitleOpts(title='缺陷发现者分布'),  # 定义图表主标题
        )
        return cloud


    # 缺陷每日新增趋势分布,已折线图显示
    def bugCloseTrendByDayOnLine(self):
        # 需要画图的dataFrame
        df_tmp = self.df.bugCloseTrendByDayInThisMonth  # 缺陷每月趋势分布(累计)
        # 定义折现图变量
        line = Line(init_opts=opts.InitOpts(theme=ThemeType.WONDERLAND))
        # 定义折线图X轴
        line.add_xaxis(df_tmp.iloc[:, 0].tolist())  # 姑且认为每月都会有新增、减少bug,大家共用1个X轴
        # 定义柱状图Y轴
        line.add_yaxis('关闭缺陷', df_tmp.iloc[:, 1].tolist(), is_smooth=False,
                       markline_opts=opts.MarkLineOpts(data=[opts.MarkLineItem(type_="average")]))
        # 定义图标全局变量
        line.set_global_opts(
            title_opts=opts.TitleOpts(
                title='缺陷关闭趋势分布',
                title_textstyle_opts=opts.TextStyleOpts(color="#FFFFFF"),  # 定义图表主标题
            ),  # 定义图表主标题
            legend_opts=opts.LegendOpts(is_show=False),  # 定义图表的图例位置
        )
        line.set_series_opts(
            # areastyle_opts=opts.AreaStyleOpts(opacity=0.5),
            label_opts=opts.LabelOpts(is_show=True, color='auto'),  # 显示数字标签
        )
        return line

    # 缺陷每日新增趋势分布,已折线图显示
    def bugCreatTrendByDayOnLine(self):
        # 需要画图的dataFrame
        df_tmp = self.df.bugCreatTrendByDayInThisMonth  # 缺陷每月趋势分布(累计)
        # 定义折现图变量
        line = Line(init_opts=opts.InitOpts(theme=ThemeType.WONDERLAND))
        # 定义折线图X轴
        line.add_xaxis(df_tmp.iloc[:, 0].tolist())  # 姑且认为每月都会有新增、减少bug,大家共用1个X轴
        # 定义柱状图Y轴
        line.add_yaxis('新增缺陷', df_tmp.iloc[:, 1].tolist(), is_smooth=False,
                       markline_opts=opts.MarkLineOpts(data=[opts.MarkLineItem(type_="average")]))
        # 定义图标全局变量
        line.set_global_opts(
            title_opts=opts.TitleOpts(
                title='缺陷创建趋势分布',
                title_textstyle_opts=opts.TextStyleOpts(color="#FFFFFF"),  # 定义图表主标题
            ),  # 定义图表主标题
            legend_opts=opts.LegendOpts(is_show=False),  # 定义图表的图例位置
        )
        line.set_series_opts(
            # areastyle_opts=opts.AreaStyleOpts(opacity=0.5),
            label_opts=opts.LabelOpts(is_show=True, color='auto'),  # 显示数字标签
        )
        return line

    def creatHtml(self):
        # 待绘制的图
        char = [
            self.bugResolutionOnLiquid(),   # 缺陷解决率
            self.kpiOnTimeLine(),  # 关键质量指标
            self.bugModuleOnBar(),          # 缺陷模块分布
            self.bugFixerOnCloud(),  # 缺陷修复者分布
            self.bugCreatTrendByDayOnLine(),  # 缺陷新增趋势
            self.bugCloseTrendByDayOnLine(),  # 缺陷关闭趋势
            self.bugTypeOnPie(),  # 缺陷类型分布
            self.bugFinderOnCloud(),        # 缺陷发现者分布
        ]
        page = Page(layout=Page.SimplePageLayout, page_title='【月度分析】'+self.proName)
        for i in char:
            page.add(i)
        page.render(
            path='【月度质量数据分析】'+self.proName + '(本月).html',
        )

        with open('【月度质量数据分析】'+self.proName + '(本月).html', "r+", encoding='utf-8') as html:
            html_bf = BeautifulSoup(html, 'lxml')
            div_title = "<div align=\"center\">\n<span style=\"font-size:40px;font face=\'黑体\';color:#FFFFFF\"><b>"+self.proName+"过程质量监控大屏(本月)</b></div>"
            divs = html_bf.select('.chart-container')
            divs[0][
                'style'] = "width:20%;height:400px;position:absolute;top:100px;left:0px;border-style:solid;border-color:#444444;border-width:0px;"
            divs[1][
                "style"] = "width:20%;height:400px;position:absolute;top:100px;left:20%;border-style:solid;border-color:#444444;border-width:0px;"
            divs[2][
                "style"] = "width:35%;height:400px;position:absolute;top:100px;left:45%;border-style:solid;border-color:#444444;border-width:0px;"
            divs[3][
                "style"] = "width:20%;height:400px;position:absolute;top:100px;left:80%;border-style:solid;border-color:#444444;border-width:0px;"
            divs[4][
                "style"] = "width:30%;height:400px;position:absolute;top:550px;left:0px;border-style:solid;border-color:#444444;border-width:0px;"
            divs[5][
                "style"] = "width:30%;height:400px;position:absolute;top:550px;left:30%;border-style:solid;border-color:#444444;border-width:0px;"
            divs[6][
                "style"] = "width:20%;height:400px;position:absolute;top:550px;left:60%;border-style:solid;border-color:#444444;border-width:0px;"
            divs[7][
                "style"] = "width:20%;height:400px;position:absolute;top:550px;left:80%;border-style:solid;border-color:#444444;border-width:0px;"

            body = html_bf.find("body")
            body["style"] = "background-color:#333333;"
            body.insert(0, BeautifulSoup(div_title, "lxml").div)
            html_new = str(html_bf)
            html.seek(0, 0)
            html.truncate()
            html.write(html_new)
            html.close()

        return page
经验总结
不足:
1、需求不清晰:从个人很难想清楚,到底要展示哪些可视化数据,即需求是自己瞎想的,展示的东西可能不符合普适化的预期。这里包括单项目内展示什么,以及没有做多项目的对比。
2、缺少展示美的能力:画出的图最终也只是比之前的好看一点点,或者说样式上不突兀,但是自己很难设计出较美观的展示效果。
3、技术储备不足:个人在pyechars上的能力不足,只能照着官网画出一些样式,一些额外的js代码等自己不会搞,很难满足进阶的要求。
收获:
1、总算是完成了,后面可以对负责的项目轻松的进行想要的质量分析维度的统计了,节省了个人成本;
2、过程中学习到了pandas、pyechars的一些基础知识,可以做一些简单的东西;
3、原来写的代码很多规范问题,本次过程中学习到并对代码做了优化修改;

 浙公网安备 33010602011771号