HydroD:辅助脚本函数
HydroD:辅助函数
在HydroD中,使用JS脚本可以快速进行模拟参数设置,但是经过尝试,HydroD中的JS脚本语言并不支持现在JavaScript中的一些语法。所以考虑采用Matlab字符串拼接能力,生成特定所需的JS脚本命令。
生成FrequencySet
HydroD中具有生成均匀间隔FrequencySet的能力,有时候需要生成不均匀FrequencySet,所以采用以下函数生成对应字符串
demo
omega=[2:0.2:5,5:0.1:10]';
omega=unique(omega);
str=CreateFreSet(omega);
function out=CreateFreSet(Fre)
% Fre:输入圆频率列向量(N*1)
head='FrequencySet1 = FrequencySet(FrequencyTypeFrequency, Array(';
tail='));';
[N,~]=size(Fre);
content=[];
for i=1:1:N-1
    content=[content,num2str(Fre(i),'%.2f rad/s ,')];
end
content=[content,num2str(Fre(N),'%.2f rad/s')];
content=[head,content,tail];
out=content;
end
Genie 绘制直线
demo
function str = genLine(Points,name)
%% 两点绘制线条JS脚本
% Curve13 = CreateLineTwoPoints(Point(0 m,0 m,0 m), Point(0 m,10 m,0 m));
head=[name,'= CreateLineTwoPoints('];
body=[];
for i=1:1:2
    tmp=['Point(',num2str(Points(i,1)),',',num2str(Points(i,2)),',',num2str(Points(i,3)),')'];
    if i~=1
        body=[body,','];
    end
    body=[body,tmp];
end
tail=');';
str=[head,body,tail];
end
Genie 绘制样条线
function str = genCrurve(Points,name)
% 生成绘制样条线JS脚本
% Points:(N*3);
[N,~]=size(Points);
head=[name,'=PolyCurve();',name,'.Clear();'];
body=[];
for i=1:1:N
    tmp=[name,'.addPoint(Point(',num2str(Points(i,1)),',',...
        num2str(Points(i,2)),',',num2str(Points(i,3)),'), ggSpline);'];
    body=[body,tmp];
end
tail=[name,'.rebuild();'];
str=[head,body,tail];
end
Genie 绘制圆
function str= genCircle(name,center,normal,r)
%% 中心、法向,半径绘制圆
% Curve= CreateCircleFromPlaneAndRadius(Point(0,0,z), Vector3d(0,0,1), r);
head=[name,'= CreateCircleFromPlaneAndRadius('];
center_=['Point(',num2str(center(1)),',',num2str(center(2)),',',num2str(center(3)),')'];
normal_=['Vector3d(',num2str(normal(1)),',',num2str(normal(2)),',',num2str(normal(3)),');'];
body=[center_,',',normal_,',',num2str(r)];
tail=');';
str=[head,body,tail];
end
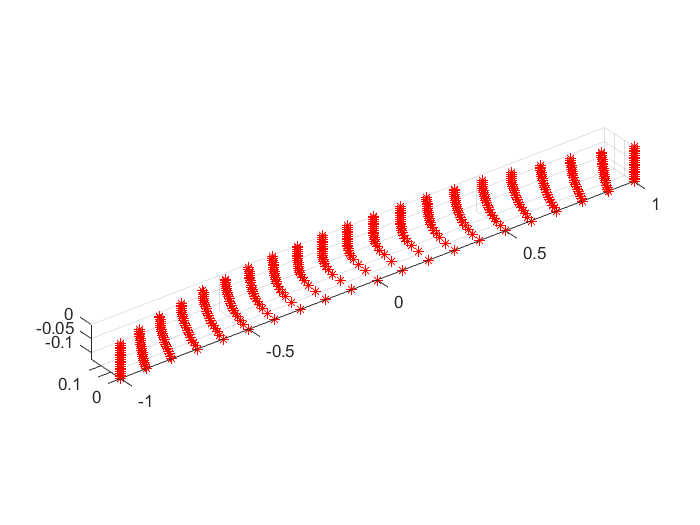
Genie绘制Wigley船型
Wigley 船型数学公式

demo
clear;clc;
L=2;            %长
B=0.3;          %宽
d=0.125;        %吃水draft
a2=0.2;a4=0.0;  %系数a2,a4
alpha=1.0;
Eta=@(Zeta,Ksi) (1-Zeta^2)*(1-Ksi^2)*...
    (1+a2*Ksi^2+a4*Ksi^4)+alpha*Zeta^2*...
    (1-Zeta^8)*(1-Ksi^2)^4;
ksi=-1:0.1:1;
zeta=0:0.05:1;
index=1;
for  i=1:1:21%x
    for k=1:1:21 %z
        index=21*(i-1)+k;
        eta=Eta(zeta(k),ksi(i));
        Points(index,:)=...
            [ksi(i)*L/2,eta*B/2,-1*zeta(k)*d];
    end
end
%% 绘图
figure(1)
plot3(Points(:,1),Points(:,2),Points(:,3),'r*');hold on
axis equal;grid on
%% 生成str字符串
str=[];
for i=1:1:21
    str_tmp=genCurve([Points(21*i-20:21*i,:)],num2str(i,'Curve%03d'));
    str=[str,str_tmp];
end


