

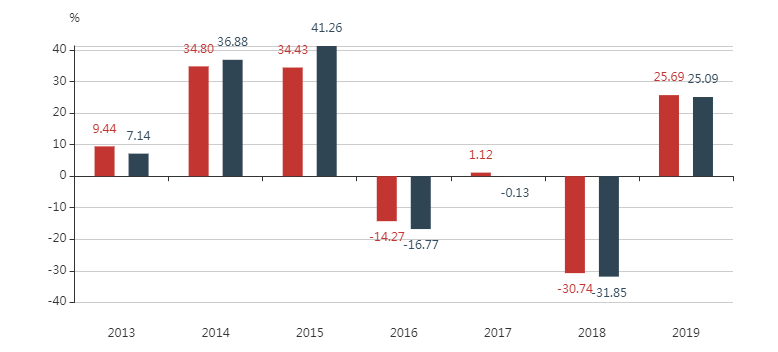
关于echarts的正负柱状图,如何去实现正数显示在柱子上面,负数显示在柱子下面
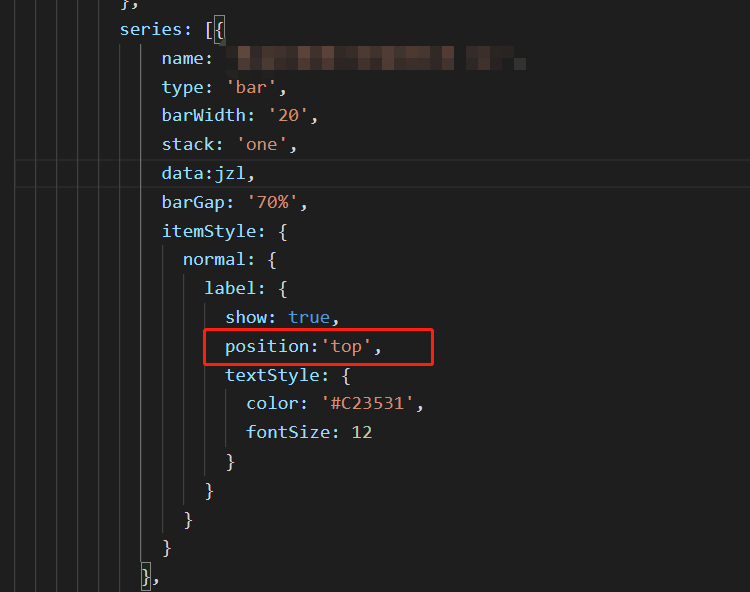
首先,想要显示数值就是如下如的方法,但是只能实现单一的上面,或者下面等等
但是我需要的是动态的去处理数据,在一个前端的提醒下使用了如下的方式,果然实现了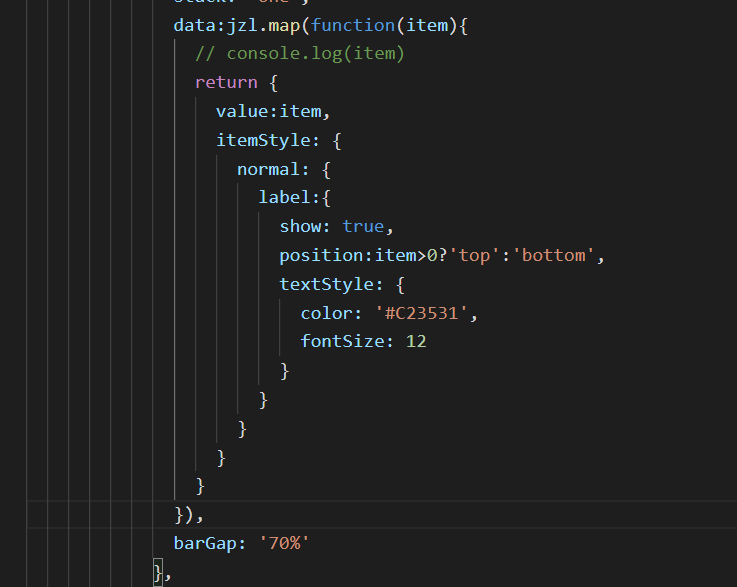
data:jzl.map(function(item){
// console.log(item)
return {
value:item,
itemStyle: {
normal: {
label:{
show: true,
position:item>0?'top':'bottom',
textStyle: {
color: '#C23531',
fontSize: 12
}
}
}
}
}
}),
这样就能够实现了
如果循环和样式卸载一起,发现柱子的颜色和自己设置的不一样,或者数值没有现实出来,可以参考以下方法
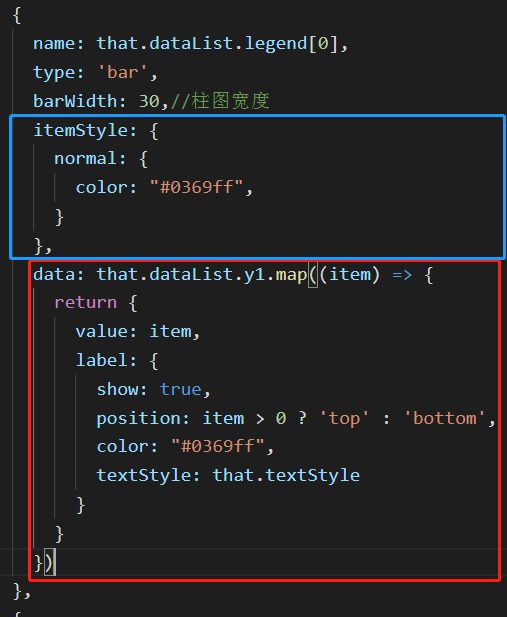
            {
              name: that.dataList.legend[0],
              type: 'bar',
              barWidth: 30,//柱图宽度
              itemStyle: {
                normal: {
                  color: "#0369ff",
                }
              },
              data: that.dataList.y1.map((item) => {
                return {
                  value: item,
                  label: {
                    show: true,
                    position: item > 0 ? 'top' : 'bottom',
                    color: "#0369ff",
                    textStyle: that.textStyle
                  }
                }
              })
            },
由于公司兼容用户比较多,要考虑到ie7以上用户,但是map方法用不了,网上百度,js加上如下代码,亲测有效
    // Production steps of ECMA-262, Edition 5, 15.4.4.19
    // Reference: http://es5.github.com/#x15.4.4.19
    if (!Array.prototype.map) {
        Array.prototype.map = function(callback, thisArg) {
          var T, A, k;
          if (this == null) {
            throw new TypeError(" this is null or not defined");
          }
          // 1. Let O be the result of calling ToObject passing the |this| value as the argument.
          var O = Object(this);

          // 2. Let lenValue be the result of calling the Get internal method of O with the argument "length".
          // 3. Let len be ToUint32(lenValue).

          var len = O.length >>> 0;

          // 4. If IsCallable(callback) is false, throw a TypeError exception.
          // See: http://es5.github.com/#x9.11
          if (typeof callback !== "function") {
            throw new TypeError(callback + " is not a function");
          }

          // 5. If thisArg was supplied, let T be thisArg; else let T be undefined.
          if (thisArg) {
            T = thisArg;
          }

          // 6. Let A be a new array created as if by the expression new Array(len) where Array is
          // the standard built-in constructor with that name and len is the value of len.
          A = new Array(len);

          // 7. Let k be 0
          k = 0;

          // 8. Repeat, while k < len
          while(k < len) {
            var kValue, mappedValue;
            if (k in O) {
              kValue = O[ k ];
              mappedValue = callback.call(T, kValue, k, O);
              A[ k ] = mappedValue;
            }
            k++;
          }
          // 9. return A
          return A;
        };
      }
关于dataZoom设置最小区间的问题和颜色的一些设置问题
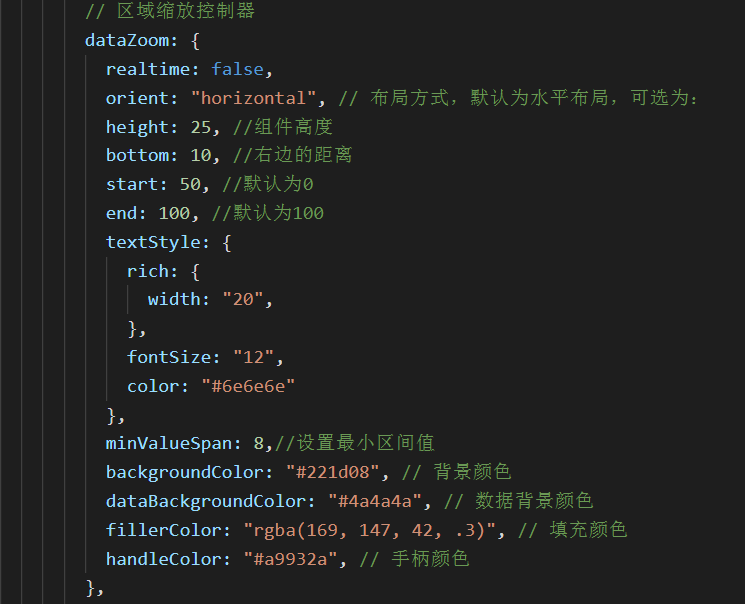
        // 区域缩放控制器
        dataZoom: {
          realtime: false,
          orient: "horizontal", // 布局方式,默认为水平布局,可选为:
          height: 25, //组件高度
          bottom: 10, //右边的距离
          start: 50, //默认为0
          end: 100, //默认为100
          textStyle: {
            rich: {
              width: "20",
            },
            fontSize: "12",
            color: "#6e6e6e"
          },
          minValueSpan: 8,//设置最小区间值
          backgroundColor: "#221d08", // 背景颜色
          dataBackgroundColor: "#4a4a4a", // 数据背景颜色
          fillerColor: "rgba(169, 147, 42, .3)", // 填充颜色
          handleColor: "#a9932a", // 手柄颜色
        },
tooltip设置十字线,两条线段的颜色和现显示的格式化
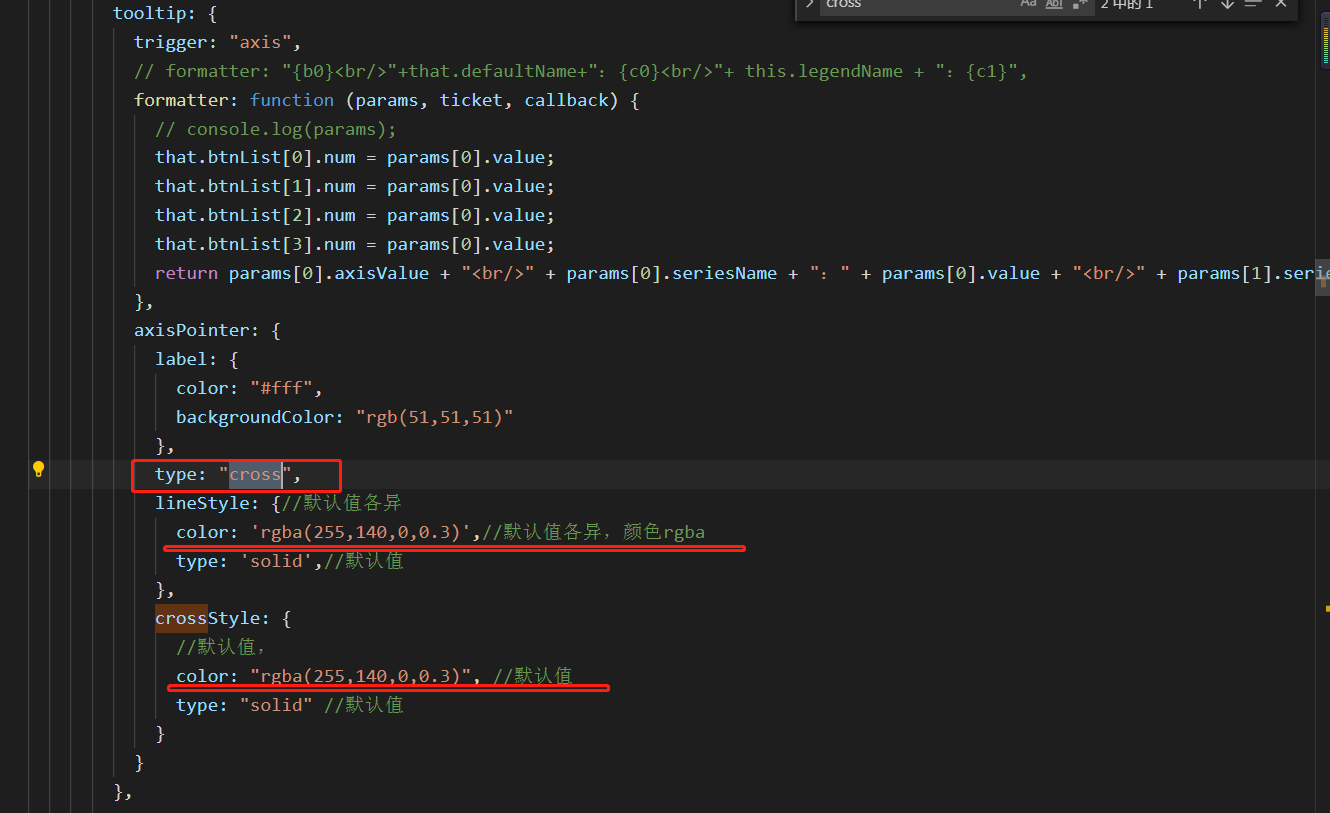
        tooltip: {
          trigger: "axis",
          // formatter: "{b0}<br/>"+that.defaultName+":{c0}<br/>"+ this.legendName + ":{c1}",
          formatter: function (params, ticket, callback) {
            // console.log(params);
            that.btnList[0].num = params[0].value;
            that.btnList[1].num = params[0].value;
            that.btnList[2].num = params[0].value;
            that.btnList[3].num = params[0].value;
            return params[0].axisValue + "<br/>" + params[0].seriesName + ":" + params[0].value + "<br/>" + params[1].seriesName + ":" + params[1].value
          },
          axisPointer: {
            label: {
              color: "#fff",
              backgroundColor: "rgb(51,51,51)"
            },
            type: "cross",
            lineStyle: {//默认值各异
              color: 'rgba(255,140,0,0.3)',//默认值各异,颜色rgba
              type: 'solid',//默认值
            },
            crossStyle: {
              //默认值,
              color: "rgba(255,140,0,0.3)", //默认值
              type: "solid" //默认值
            }
          }
        },
dataZoom滑块固定区间,禁止改变区间,显示固定的显示个数,代码和效果
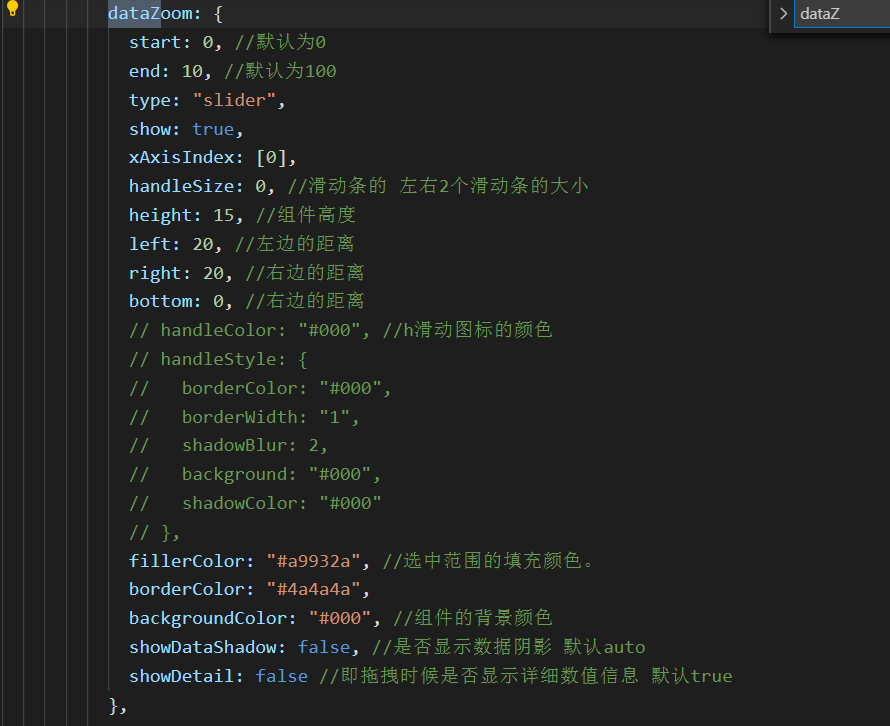
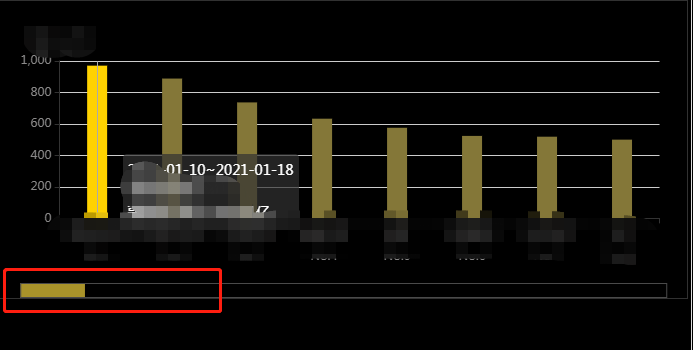
          dataZoom: {
            start: 0, //默认为0
            end: 10, //默认为100
            type: "slider",
            show: true,
            xAxisIndex: [0],
            handleSize: 0, //滑动条的 左右2个滑动条的大小
            height: 15, //组件高度
            left: 20, //左边的距离
            right: 20, //右边的距离
            bottom: 0, //右边的距离
            // handleColor: "#000", //h滑动图标的颜色
            // handleStyle: {
            //   borderColor: "#000",
            //   borderWidth: "1",
            //   shadowBlur: 2,
            //   background: "#000",
            //   shadowColor: "#000"
            // },
            fillerColor: "#a9932a", //选中范围的填充颜色。
            borderColor: "#4a4a4a",
            backgroundColor: "#000", //组件的背景颜色
            showDataShadow: false, //是否显示数据阴影 默认auto
            showDetail: false //即拖拽时候是否显示详细数值信息 默认true
          },
仅作为个人记录
