
ECharts相关
一、
效果图
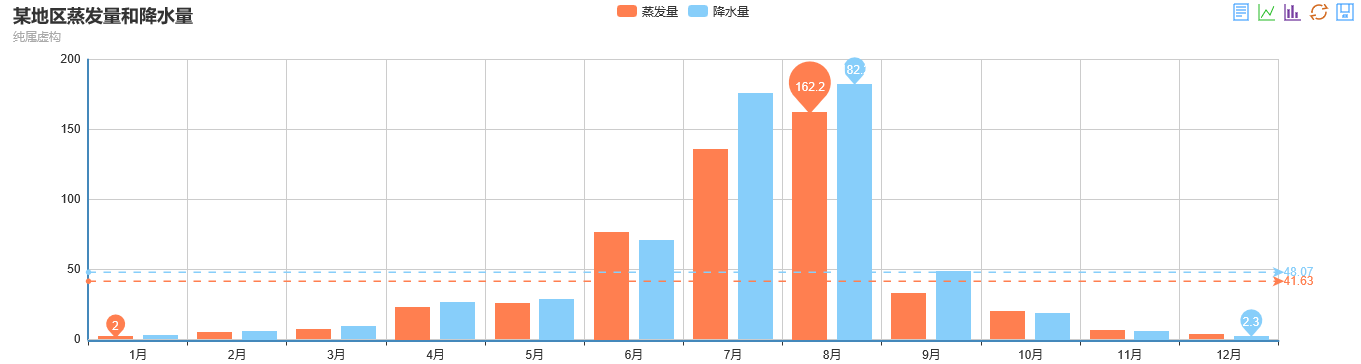
代码:


@{
    Layout = null;
}

<!DOCTYPE html>

<html>
<head>
    <meta name="viewport" content="width=device-width" />
    <title>EchartsViewTwo</title>
    <script src="~/Scripts/jquery-3.3.1.min.js"></script>
    <script src="~/Scripts/ECharts/echarts.js"></script>
    <script type="text/javascript">
        // 路径配置
        require.config({
            paths: {
                echarts: '/Scripts/echarts' //echarts路径
            }
        });
        // 使用
        require(
            [
                'echarts', //echarts路径
                'echarts/chart/bar', // 使用柱状图就加载bar模块,按需加载
                'echarts/chart/line' // 使用柱状图就加载bar模块,按需加载
            ],
            function (ec) {
                // 基于准备好的dom,初始化echarts图表
                var myChart = ec.init(document.getElementById('main'));

                option = {
                    title: {
                        text: '某地区蒸发量和降水量',
                        subtext: '纯属虚构'
                    },
                    tooltip: {
                        trigger: 'axis'
                    },
                    legend: {
                        data: ['蒸发量', '降水量']
                    },
                    toolbox: {
                        show: true,
                        feature: {
                            dataView: { show: true, readOnly: false },
                            magicType: { show: true, type: ['line', 'bar'] },
                            restore: { show: true },
                            saveAsImage: { show: true }
                        }
                    },
                    calculable: true,
                    xAxis: [
                        {
                            type: 'category',
                            data: ['1月', '2月', '3月', '4月', '5月', '6月', '7月', '8月', '9月', '10月', '11月', '12月']
                        }
                    ],
                    yAxis: [
                        {
                            type: 'value'
                        }
                    ],
                    series: [
                        {
                            name: '蒸发量',
                            type: 'bar',
                            data: [2.0, 4.9, 7.0, 23.2, 25.6, 76.7, 135.6, 162.2, 32.6, 20.0, 6.4, 3.3],
                            markPoint: {
                                data: [
                                    { type: 'max', name: '最大值' },
                                    { type: 'min', name: '最小值' }
                                ]
                            },
                            markLine: {
                                data: [
                                    { type: 'average', name: '平均值' }
                                ]
                            }
                        },
                        {
                            name: '降水量',
                            type: 'bar',
                            data: [2.6, 5.9, 9.0, 26.4, 28.7, 70.7, 175.6, 182.2, 48.7, 18.8, 6.0, 2.3],
                            markPoint: {
                                data: [
                                    { name: '年最高', value: 182.2, xAxis: 7, yAxis: 183 },
                                    { name: '年最低', value: 2.3, xAxis: 11, yAxis: 3 }
                                ]
                            },
                            markLine: {
                                data: [
                                    { type: 'average', name: '平均值' }
                                ]
                            }
                        }
                    ]
                };
                // 为echarts对象加载数据
                myChart.setOption(option);
            }
        );
    </script>
</head>
<body>
    <div id="main" style=" height:400px;"></div>
</body>
</html>
二、
效果图
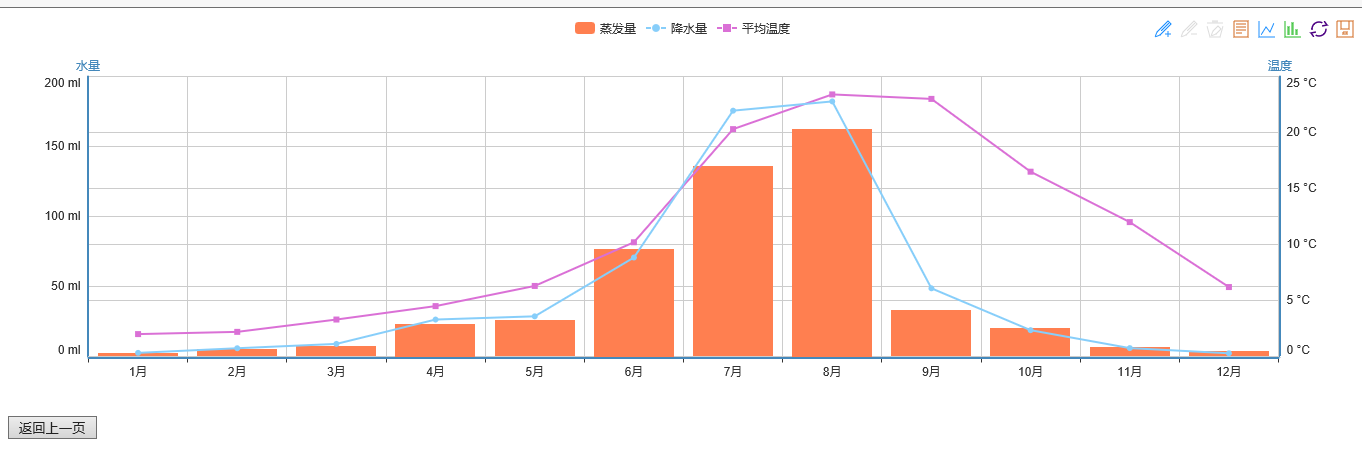
代码:
@{
    Layout = null;
}

<!DOCTYPE html>

<html>
<head>
    <meta name="viewport" content="width=device-width" />
    <title>EchartsView</title>
    <script src="~/Scripts/jquery-3.3.1.min.js"></script>
    <script src="~/Scripts/ECharts/echarts.js"></script>
    <script type="text/javascript">
        // 路径配置
        require.config({
            paths: {
                echarts: '/Scripts/echarts' //echarts路径
            }
        });
        // 使用
        require(
            [
                'echarts', //echarts路径
                'echarts/chart/bar', // 使用柱状图就加载bar模块,按需加载
                'echarts/chart/line' // 使用柱状图就加载bar模块,按需加载
            ],

            function (ec) {
                // 基于准备好的dom,初始化echarts图表
                var myChart = ec.init(document.getElementById('main'));

                option = {
                    tooltip: {
                        trigger: 'axis'
                    },

                    //右侧工具栏
                     toolbox: {
                         show: true,
                         feature: {
                             mark: { show: true },
                             dataView: { show: true, readOnly: false },
                             magicType: { show: true, type: ['line', 'bar'] },
                             restore: { show: true },
                             saveAsImage: { show: true }
                         }
                     },
                     calculable: true,
                    legend: {
                        data: ['蒸发量', '降水量', '平均温度']
                    },
                    //横轴信息
                    xAxis: [
                        {
                            type: 'category',
                            data: ['1月', '2月', '3月', '4月', '5月', '6月', '7月', '8月', '9月', '10月', '11月', '12月']
                        }
                    ],
                    //纵轴信息
                    yAxis: [
                        {
                            type: 'value',
                            name: '水量',
                            axisLabel: {
                                formatter: '{value} ml'
                            }
                        },
                        {
                            type: 'value',
                            name: '温度',
                            axisLabel: {
                                formatter: '{value} °C'
                            }
                        }
                    ],
                    //数据系列
                    series: [

                        {
                            name: '蒸发量',
                            type: 'bar',
                            data: [2.0, 4.9, 7.0, 23.2, 25.6, 76.7, 135.6, 162.2, 32.6, 20.0, 6.4, 3.3]
                        },
                        {
                            name: '降水量',
                            type: 'line',
                            data: [2.6, 5.9, 9.0, 26.4, 28.7, 70.7, 175.6, 182.2, 48.7, 18.8, 6.0, 2.3]
                        },
                        {
                            name: '平均温度',
                            type: 'line',
                            yAxisIndex: 1,
                            data: [2.0, 2.2, 3.3, 4.5, 6.3, 10.2, 20.3, 23.4, 23.0, 16.5, 12.0, 6.2]
                        }
                    ]
                };


                // 为echarts对象加载数据
                myChart.setOption(option);
            }
        );

        function ReturnClik() {
            location.href = "/Echarts/Index";
        }
    </script>
</head>
<body>
    <div id="main" style=" height:400px;"></div>
    <input type="button" onclick="ReturnClik();" value="返回上一页">
</body>
</html>
三、到官网下载的js
1.引入 echarts.min.js 和 china.js
效果图:
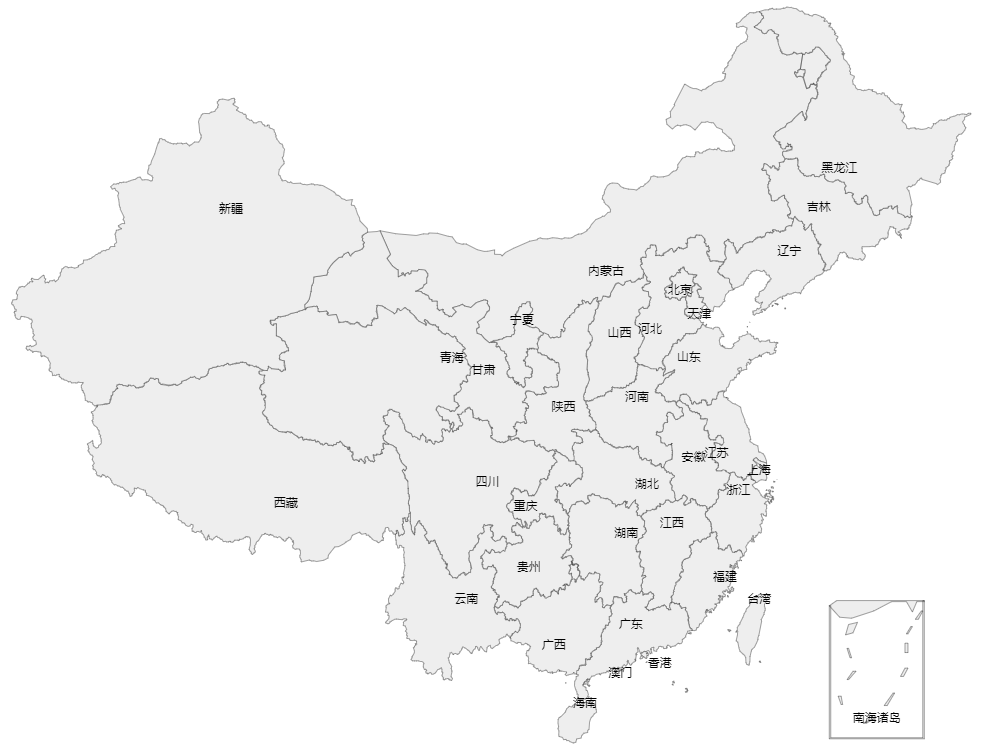
代码:
<!DOCTYPE html>

<html>
<head>
    <meta name="viewport" content="width=device-width" />
    <title>TestView</title>
    <script src="~/Scripts/jquery-1.10.2.min.js"></script>
    <!-- 引入 ECharts 文件 -->
    <script src="~/Scripts/ECharts/echarts.min.js"></script>
    <script src="~/Scripts/ECharts/china.js"></script>

</head>
<body>
    <!-- 为ECharts准备一个具备大小(宽高)的Dom -->
    <div id="map" style="width:1200px;height:1200px;"></div>
    <script type="text/javascript">
        // 基于准备好的dom,初始化echarts实例
        var myChart = echarts.init(document.getElementById('map'));
        myChart.setOption({
            series: [{
                type: 'map',
                map: 'china',
                label: {
                    normal: {
                        show: true
                    },
                    emphasis: {
                        show: true
                    }
                }
            }]
        });
        myChart.on('click', function (params) {
            console.log(params.name);
        });
        window.addEventListener("resize", function () {
            myChart.resize();
        });
    </script>
</body>
</html>
            var myChartMap = echarts.init(document.getElementById('map'));
            myChartMap.setOption({
                series: [{
                    type: 'map',
                    map: 'china',
                    zoom: 1.2,   //这里是关键,一定要放在 series中
                    label: {
                        normal: {
                            show: true,
                            textStyle: {
                                fontSize: 15,
                                fontWeight: 'bold',
                                color: 'red'  //地方名称颜色
                            }
                        },
                        emphasis: {
                            show: true
                        }
                    },
                    layoutCenter: ['30%', '30%'],
                    itemStyle: {
                                normal: {
                                  borderWidth: 0.5, // 区域边框宽度
                                  borderColor: '#009fe8', // 区域边框颜色
                                  areaColor: '#ffefd5', // 区域颜色
                                },
                                emphasis: {//鼠标移上去背景色
                                  borderWidth: 0.5,
                                  borderColor: '#4b0082',
                                  areaColor: '#ffdead'
                                }
                    },
                }]
            });
            myChartMap.on('click', function (params) {
                console.log(params.name);
            });
            window.addEventListener("resize", function () {
                myChartMap.resize();
            });
四、中国地图为不同省份设置背景色
效果图:
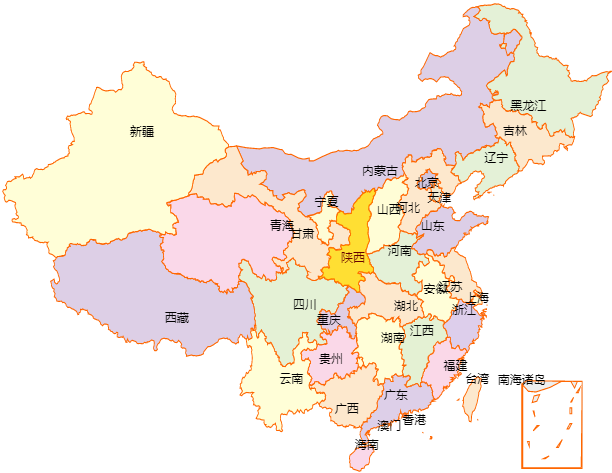
分享代码:
    var myChartMap = echarts.init(document.getElementById('map'));
    myChartMap.setOption({
    series : [
                {
                   name: '随机数据',
                   type: 'map',
                   mapType: 'china',
                   selectedMode : 'single',
                   itemStyle:{
                        normal:{
                        label:{show:true},
                        borderWidth:1,//省份的边框宽度
                        borderColor:'#f60',//省份的边框颜色
                           color:'#ece2df'//地图背景颜色
                        //areaStyle:{color:'#f60'}//设置地图颜色
                    },
                       emphasis:{label:{show:true}}
                },
                data:[
                   {name: '北京', selected:false,value:1},
                   {name: '天津', selected:false,value:2},
                   {name: '上海', selected:false,value:3},
                   {name: '重庆', selected:false,value:4},
                   {name: '河北', selected:false,value:5},
                   {name: '河南', selected:false,value:6},
                   {name: '云南', selected:false,value:7},
                   {name: '辽宁', selected:false,value:8},
                   {name: '黑龙江', selected:false,value:9},
                   {name: '湖南', selected:false,value:10},
                   {name: '安徽', selected:false,value:11},
                   {name: '山东', selected:false,value:12},
                   {name: '新疆', selected:false,value:13},
                   {name: '江苏', selected:false,value:14},
                   {name: '浙江', selected:false,value:15},
                   {name: '江西', selected:false,value:16},
                   {name: '湖北', selected:false,value:17},
                   {name: '广西', selected:false,value:18},
                   {name: '甘肃', selected:false,value:19},
                   {name: '山西', selected:false,value:20},
                   {name: '内蒙古', selected:false,value:21},
                   {name: '陕西', selected:false,value:22},
                   {name: '吉林', selected:false,value:23},
                   {name: '福建', selected:false,value:24},
                   {name: '贵州', selected:false,value:25},
                   {name: '广东', selected:false,value:26},
                   {name: '青海', selected:false,value:27},
                   {name: '西藏', selected:false,value:28},
                   {name: '四川', selected:false,value:29},
                   {name: '宁夏', selected:false,value:30},
                   {name: '海南', selected:false,value:31},
                   {name: '台湾', selected:false,value:32},
                   {name: '香港', selected:false,value:33},
                   {name: '澳门', selected:false,value:34}
               ]//各省地图颜色数据依赖value
           }
        ],
    dataRange:{
           x: '-1000px',//图例横轴位置
           y: '-1000px',//图例纵轴位置
           splitList: [
                {start:1, end:1, label: '北京', color: '#cfc5de'},
                {start:2, end:2, label: '天津', color: '#f1ebd1'},
                {start:3, end:3, label: '上海', color: '#feffdb'},
                {start:4, end:4, label: '重庆', color: '#e0cee4'},
                {start:5, end:5, label: '河北', color: '#fde8cd'},
                {start:6, end:6, label: '河南', color: '#e4f1d7'},
                {start:7, end:7, label: '云南', color: '#fffed7'},
                {start:8, end:8, label: '辽宁', color: '#e4f1d7'},
                {start:9, end:9, label: '黑龙江', color: '#e4f1d7'},
                {start:10, end:10, label: '湖南', color: '#fffed7'},
                {start:11, end:11, label: '安徽', color: '#fffed8'},
                {start:12, end:12, label: '山东', color: '#dccee7'},
                {start:13, end:13, label: '新疆', color: '#fffed7'},
                {start:14, end:14, label: '江苏', color: '#fce8cd'},
                {start:15, end:15, label: '浙江', color: '#ddceeb'},
                {start:16, end:16, label: '江西', color: '#e4f1d3'},
                {start:17, end:17, label: '湖北', color: '#fde8cd'},
                {start:18, end:18, label: '广西', color: '#fde8cd'},
                {start:19, end:19, label: '甘肃', color: '#fde8cd'},
                {start:20, end:20, label: '山西', color: '#fffdd6'},
                {start:21, end:21, label: '内蒙古', color: '#ddcfe6'},
                {start:22, end:22, label: '陕西', color: '#fad8e9'},
                {start:23, end:23, label: '吉林', color: '#fce8cd'},
                {start:24, end:24, label: '福建', color: '#fad8e8'},
                {start:25, end:25, label: '贵州', color: '#fad8e8'},
                {start:26, end:26, label: '广东', color: '#ddcfe8'},
                {start:27, end:27, label: '青海', color: '#fad8e9'},
                {start:28, end:28, label: '西藏', color: '#ddcfe6'},
                {start:29, end:29, label: '四川', color: '#e4f1d5'},
                {start:30, end:30, label: '宁夏', color: '#fefcd5'},
                {start:31, end:31, label: '海南', color: '#fad8e9'},
                {start:32, end:32, label: '台湾', color: '#fce8cd'},
                {start:33, end:33, label: '香港', color: '#dc9bbb'},
                {start:34, end:34, label: '澳门', color: '#e0f7cc'}
           ]
       } //各省地图颜色;start:值域开始值;end:值域结束值;label:图例名称;color:自定义颜色值;

    });
    myChartMap.on('click', function (params) {
        console.log(params.name);
    });
    window.addEventListener("resize", function () {
        myChartMap.resize();
    });
|
作者:chenze 出处:https://www.cnblogs.com/chenze-Index/ 本文版权归作者和博客园共有,欢迎转载,但未经作者同意必须保留此段声明,且在文章页面明显位置给出原文连接,否则保留追究法律责任的权利。 如果文中有什么错误,欢迎指出。以免更多的人被误导。 |

 浙公网安备 33010602011771号