数据分析python应用到的ggplot(二)
还是优达学院的第七课
数据:https://s3.amazonaws.com/content.udacity-data.com/courses/ud359/hr_by_team_year_sf_la.csv
ggplot:
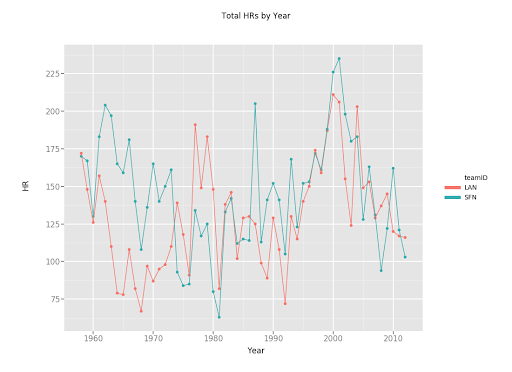
gp = pandas.read_csv(hr_by_team_year_sf_la_csv)
gg =  ggplot(gp,aes('yearID','HR',color = 'teamID')) + geom_point() + geom_line() + ggtitle('Total HRs by Year') + xlab('Year') +ylab('HR')
图形:
easy learnning:
from ggplot import *
ggplot(aes(x='date',y='beef'),data=meat)+geom_line()+stat_smooth(colour='blue', span=0.2)
图形: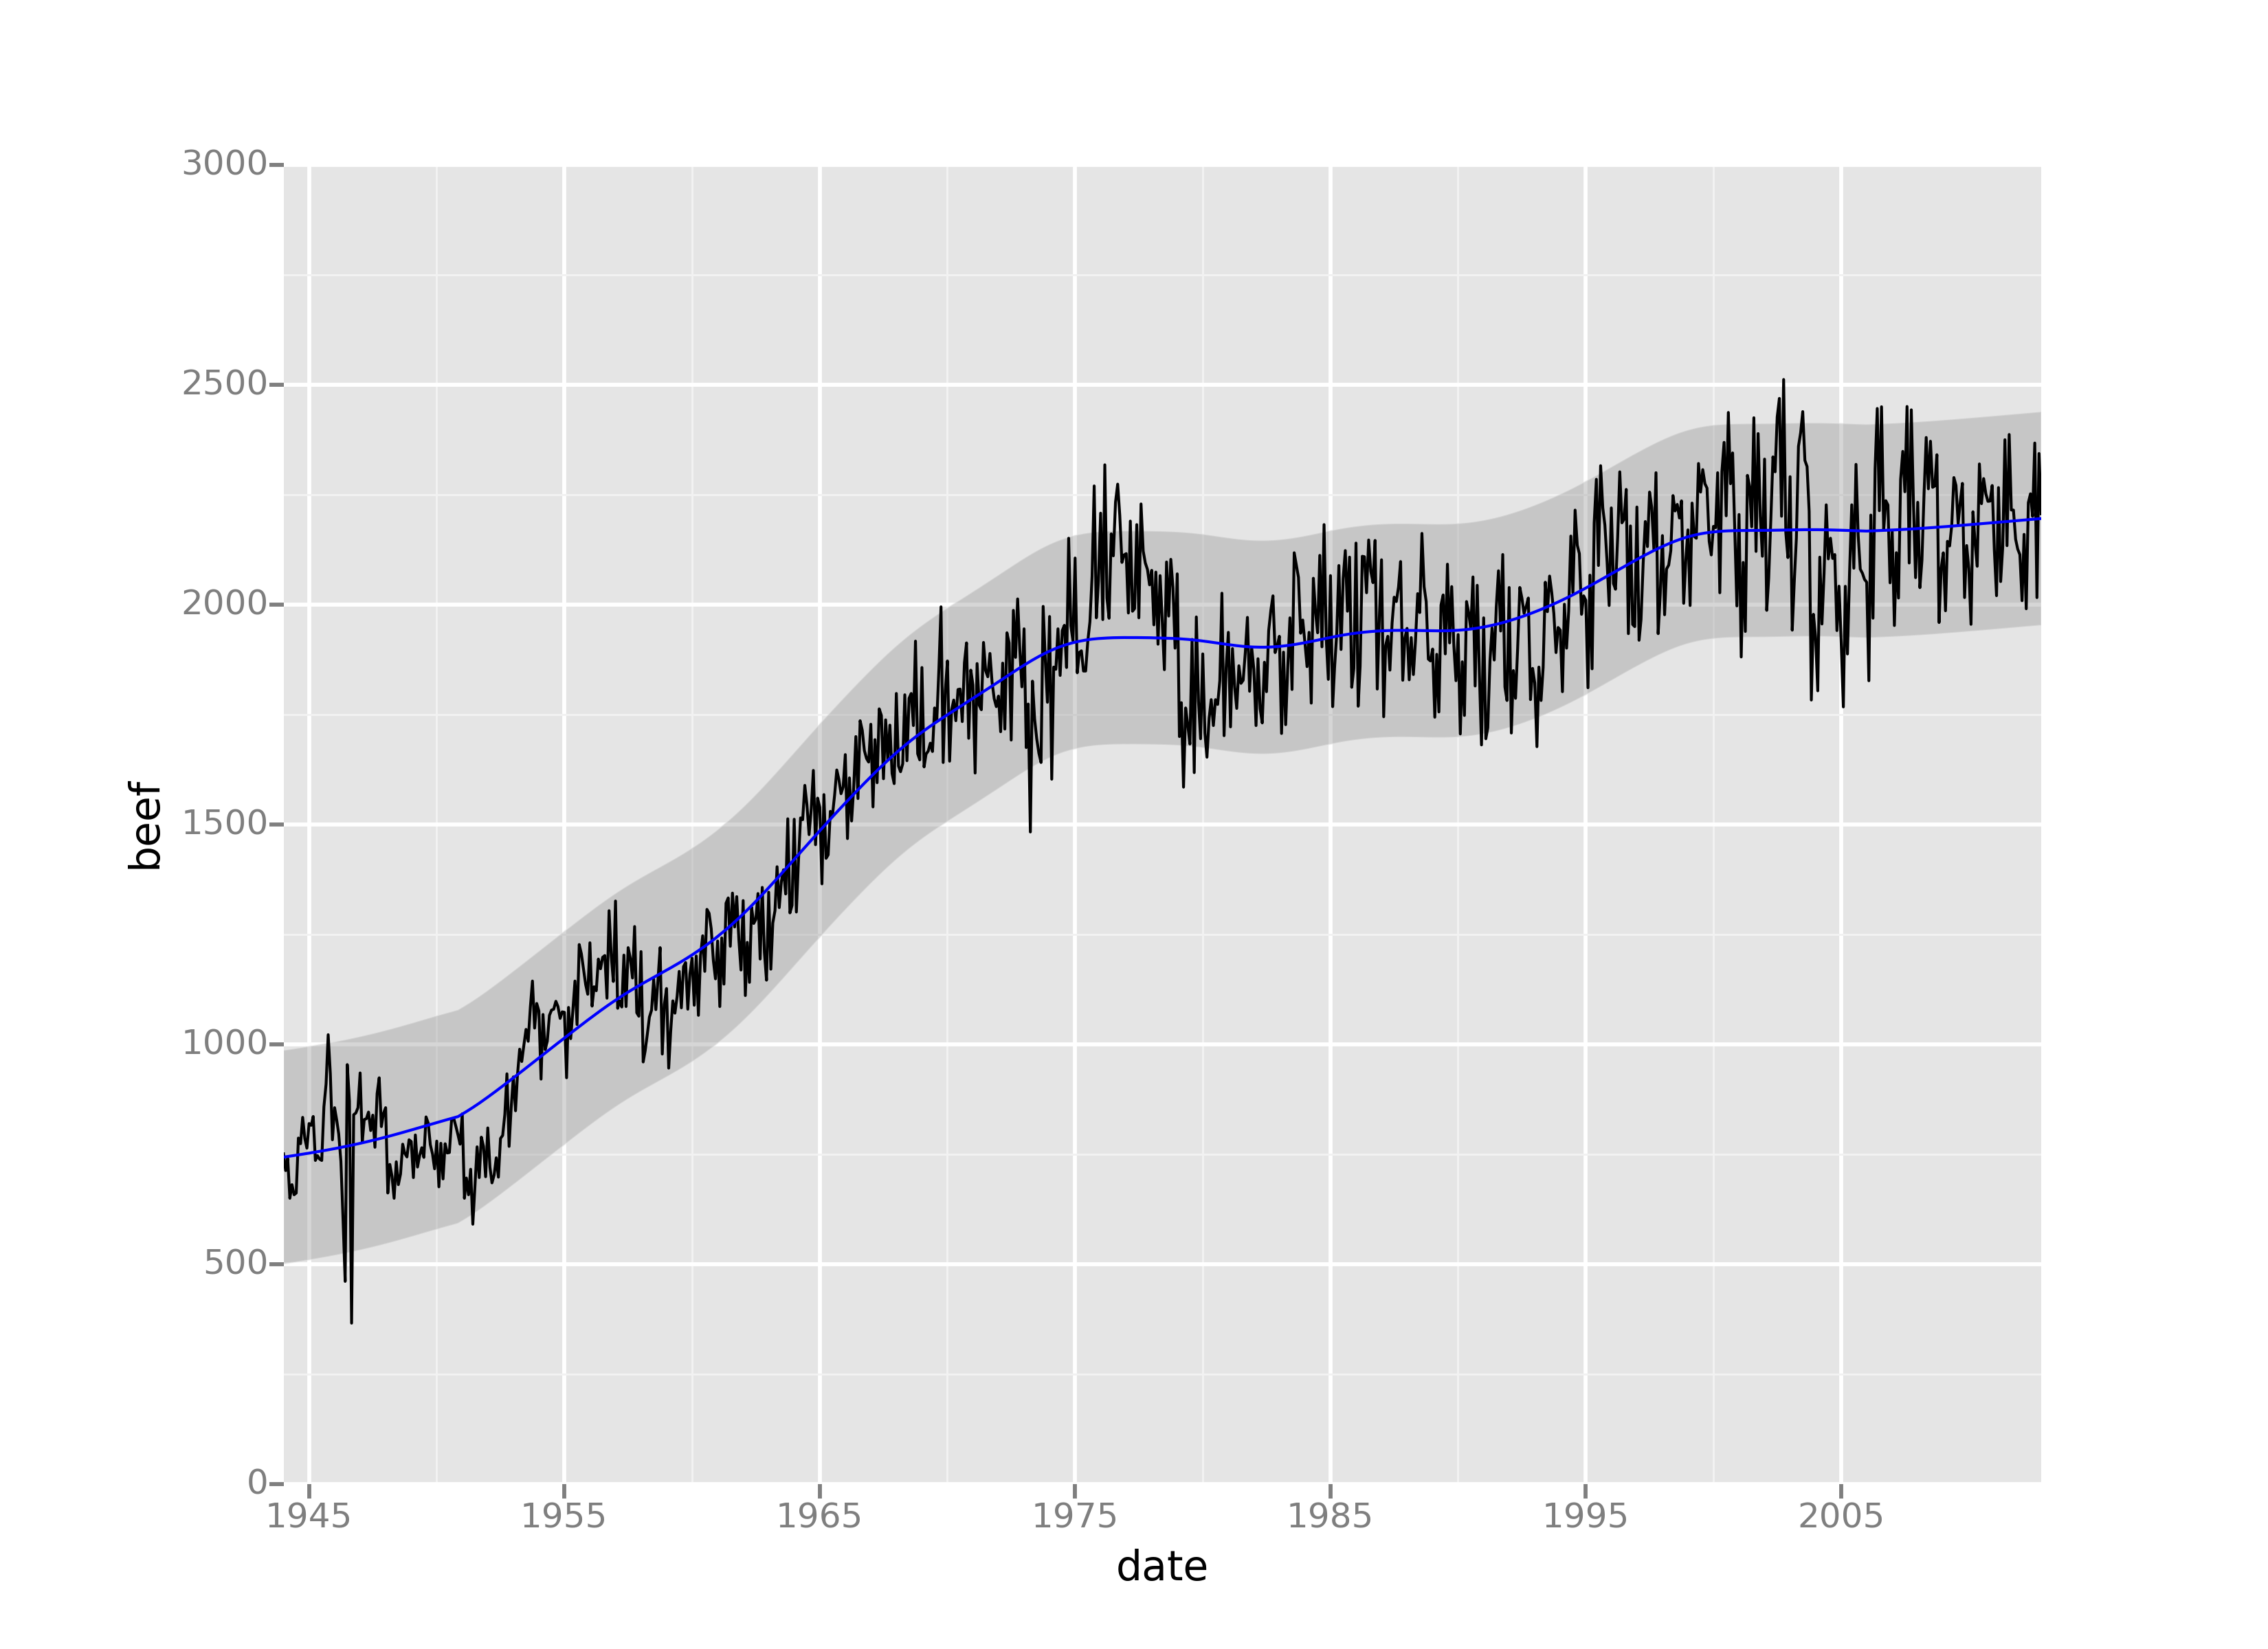

 浙公网安备 33010602011771号