数据分析python应用到的ggplot
数据分析中应用到python中的ggplot库,可以用来画图
数据之类的用优达学院中课程七中的数据为例
数据是:https://s3.amazonaws.com/content.udacity-data.com/courses/ud359/hr_year.csv
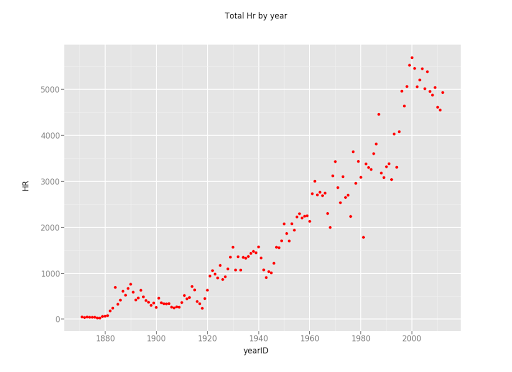
- 散点图:
gp=pandas.read_csv(hr_year_csv)
gg=ggplot(gp,aes('yearID','HR'))+geom_point(color='red')+ggtitle(u'Total Hr by year')
图展示为
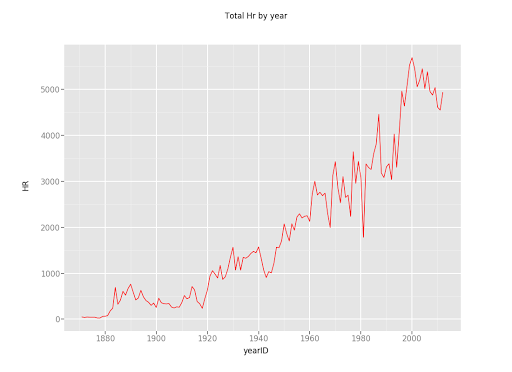
2.折线图
gp=pandas.read_csv(hr_year_csv)
gg=ggplot(gp,aes('yearID','HR'))+geom_line(color='red')+ggtitle(u'Total Hr by year')
图展示为:
3. 散点+折线
gp=pandas.read_csv(hr_year_csv)
gg=ggplot(gp,aes('yearID','HR'))+geom_line(color='red')+geom_point(color='red')+ggtitle(u'Total Hr by year')
图展示为:


 浙公网安备 33010602011771号