

Python工具集之数据可视化包Matplotlib(二)
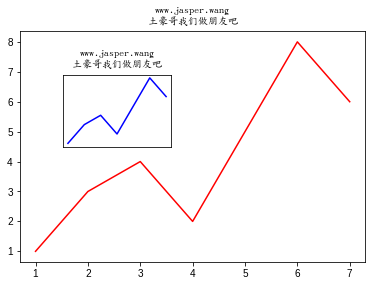
Table of Contents
- 1.2 基础制图
- 1.2.1 添加 x, y 值
- 1.2.2 配置图形颜色和形状
- 1.2.3 控制线条属性-使用关键字linewidth
- 1.2.4 控制线条属性-使用setter方法
- 1.2.5 控制线条属性-使用setp()命令
- 1.2.6 添加 x,y 轴的标签 plt.ylabel()
- 1.2.7 将 x,y 轴坐标转换成字符坐标 plt.xticks(), plt.yticks()
- 1.2.8 隐藏边框 plt.gca(), ax.spines[].set_color()
- 1.2.9 移动坐标轴与刻度 plt.gca(), ax.spines[], ax.xaxis.set_ticks_position()
- 1.2.10 配置x轴和y轴范围 plt.xlim(), plt.ylim()
- 1.2.11 配置x轴和y轴范围的第二种方法 plt.xlim(), plt.ylim()
- 1.2.12 配置x轴和y轴范围的第三种方法 plt.axis([xmin,xmax,ymin,ymax])
- 1.2.13 配置多条曲线
- 1.2.14 配置多条曲线的第二种方法
- 1.2.15 配置图例 plt.legend()
- 1.2.16 添加标题 title
- 1.2.17 添加网格 grid()
- 1.2.18 添加文本 text()
- 1.2.19 标注特殊点之 annotate()
- 1.2.20 标注特殊点之 plt.scatter()
- 1.3.3 Figures 语法
- 1.3.4 Subplot 语法
- 1.3.5 Axes 语法
- 1.3.6 使用Axes函数得到与subplot相同的显示效果
- 1.3.7 嵌入式Axes,使用句柄 fig.add_axes([left, bottom, width, height])
- 1.3.8 创建并配置两个plot
- 1.3.9 子图共享坐标轴
- 1.3.10 调整子图位置以避免覆盖 plt.tight_layout
- 1.3.11 在plot的axes中标注特殊点详细语法 annotate()
- 1.3.12 Subplot画板切片 GridSpec
- 1.3.13 可用于二元对比的柱形图 plt.bar
- 1.3.14 比较历史走势的堆积图
- 1.3.15 可用于商业数据分析的其他Axes辅助方法
Matplotlib组件
- 以上基础制图操作,是直接在单一figure和axes中实现快速绘图
- 此外,还可以使用 figure,subplot 和 axes 配置布局
- figure 是 matplotlib 中面向用户的界面,在 figure 内部配置 subplots
- subplot 指定 plots 在 figure 中的位置
- axes 是被指定位置后的的 plots
- 之前的代码并没有声明它们,即: 使用缺省配置
- 如果要调用plot
- plt.gca() Get Current Axes, 获取当前 axes
- plt.gcf() Get Current Figure, 获取当前 figure
Figure, Subplot, Axes的关系
- 一个Figure是一个空白的画板
- Figure可以切割为一个或多个Sublots
- 切割后, 每一个Subplot也是一个空白的画板
- Axes是布局在画板上的轴域(包含纵轴xaxix, 横轴yaxis等信息)
- Axes可以直接布局在Figure之上, 也可以布局在每一个Subplot之上
- 一个Figure(或subplot)上可以包含一个或多个Axes
- Subplots的位置, 只能按照既定规则排列显示在Figure之上
- Axes的位置, 可以在任意位置显示, 还可以跨Subplots显示
Figure, Subplot, Axes示例
查看对象基本类型
fig1: class 'matplotlib.figure.Figure'
ax1: class 'matplotlib.axes._axes.Axes', 直接配置在Figure之上的axes
ax3: class 'matplotlib.axes._subplots.AxesSubplot', 配置在subplot之上的axes
声明一个空白Figure
fig = plt.figure()
print(type(fig))
# 可以发现对象类型为: <class 'matplotlib.figure.Figure'>
<class 'matplotlib.figure.Figure'>


<Figure size 432x288 with 0 Axes>
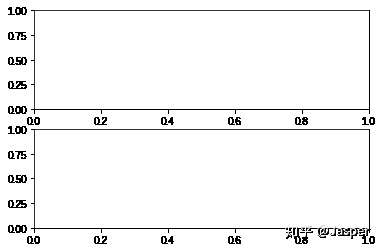
声明2行1列subplots fig.add_subplot()
fig = plt.figure()
ax1 = fig.add_subplot(211)
ax2 = fig.add_subplot(212)
print(type(ax1))
# 可以发现对象类型为: <class 'matplotlib.axes._subplots.AxesSubplot'>
<class 'matplotlib.axes._subplots.AxesSubplot'>
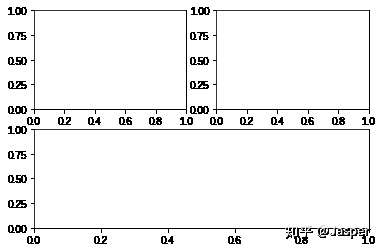
声明2行,第一行2列,第二行1列的subplots(第二种声明方法) plt.subplot()
ax1 = plt.subplot(221) # 第一行的左图
ax2 = plt.subplot(222) # 第一行的右图
ax3 = plt.subplot(212) # 第二整行
print(type(ax1))
# 可以发现对象类型为: <class 'matplotlib.axes._subplots.AxesSubplot'>
<class 'matplotlib.axes._subplots.AxesSubplot'>
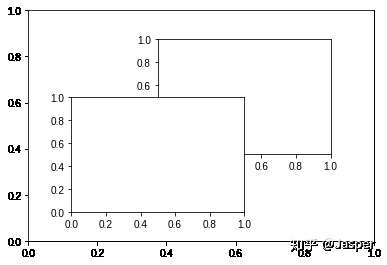
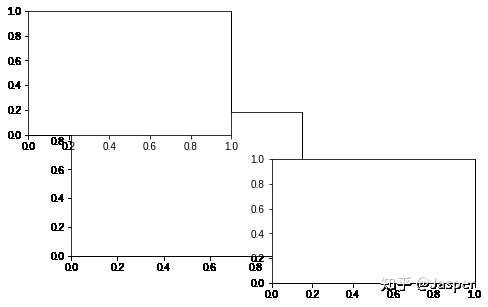
声明三个轴域(直接在Figure之上),第二个和第三个重叠(且都覆盖在第一个之上) fig.add_axes()
fig = plt.figure()
ax1 = fig.add_axes([0.1, 0.1, 0.8, 0.8]) # 四个参数分别代表起点的x,y值和终点的x,y值
ax2 = fig.add_axes([0.4, 0.4, 0.4, 0.4])
ax3 = fig.add_axes([0.2, 0.2, 0.4, 0.4])
print(type(ax1))
# 可以发现对象类型为: <class 'matplotlib.axes._axes.Axes'>
<class 'matplotlib.axes._axes.Axes'>
同时声明 Axes 和 Subplot
fig1=plt.figure(figsize=(8, 5))
# 在fig1中配置一个轴域
ax1 = plt.Axes(fig1,[0.2, 0.2, 0.4, 0.4])
# 需要执行add操作将其添加到fig中
fig1.add_axes(ax1)
# 清除axes的方法
# ax1.set_axis_off()
# 如果使用plt.subplot方法配置,会清除上一段代码中配置的axes
# ax1=plt.subplot(221)
# ax3=plt.subplot(223)
# 将Figure切割为2行2列,配置其中的第一个和第四个
ax1=fig1.add_subplot(221)
ax2=fig1.add_subplot(224)
声明一个带有ax的非空白Figure
fig, ax = plt.subplots()
print(type(ax))
# 可以发现ax对象类型为: <class 'matplotlib.axes._subplots.AxesSubplot'>
<class 'matplotlib.axes._subplots.AxesSubplot'>
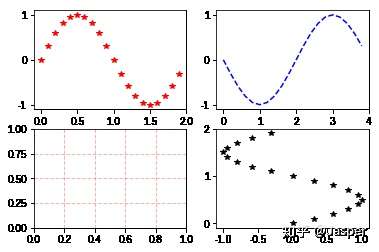
声明Axes后为每一个subplot(ax数组中的列表中的成员)配置轴域信息
t=np.arange(0.0,2.0,0.1)
s=np.sin(t*np.pi)
figure, ax=plt.subplots(2,2)
ax[0][0].plot(t,s,'r*')       # 配置第1个plot
ax[0][1].plot(t*2,-s,'b--')   # 配置第2个plot
ax[1][0].grid(color='r', linestyle='--', linewidth=1, alpha=0.3) # 配置第3个plot网格
ax[1][1].plot(s,t,'k*')       # 配置第4个plot
print(type(ax))
ax
# 可以发现ax对象类型为: <class 'numpy.ndarray'>, 表示ax是一个包含Subplot之上的Axes的列表的数组
<class 'numpy.ndarray'>


array([[<matplotlib.axes._subplots.AxesSubplot object at 0x7fd08d7fd748>,
        <matplotlib.axes._subplots.AxesSubplot object at 0x7fd08e189c18>],
       [<matplotlib.axes._subplots.AxesSubplot object at 0x7fd08d9d7a90>,
        <matplotlib.axes._subplots.AxesSubplot object at 0x7fd08ea3f198>]],
      dtype=object)
Figures 语法
figure(num = None, figsize = None, dpi = None, facecolor = None, edgecolor = None, frameon = True)
|参数 | 默认值 | 描述| |:-|:-|:-| |num|1|图像编号或名称,数字为编号 ,字符串为名称| |figsize|figure.figsize|指定figure的宽和高,单位为英寸| |dpi|figure.dpi|指定绘图对象的分辨率,即每英寸多少个像素,缺省值为80| |facecolor|figure.facecolor|背景颜色| |edgecolor|figure.edgecolor|边框颜色| |frameon|True|是否显示边框|
Subplot 语法
subplot(nrows, ncols, sharex, sharey, subplot_kw, **fig_kw)
|参数|描述| |:-|:-| |nrows|subplot的行数| |ncols|subplot的列数| |sharex|共享的x轴| |sharey|共享的y轴| |subplot_kw|subplot关键字| |**fig_kw|figure关键字,如plt.subplots(2, 2, figsize=(8, 6))|
Axes 语法
- Axes(fig, rect, facecolor=None, frameon=True, sharex=None, sharey=None, label='', xscale=None, yscale=None, **kwargs)
- rect = [left, bottom, width, height] in Figure coordinates
- 针对axes操作可以得到与subplot相同的显示效果, 但所使用的函数形式稍有不同
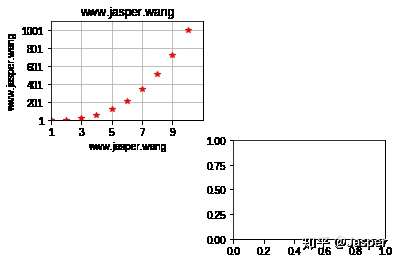
使用Axes函数得到与subplot相同的显示效果
figure, ax=plt.subplots(2, 2)
x= np.arange(1, 11, 1)
y= x**3
ax[0][0].plot(x, y, 'r*')
ax[0][0].set_xlabel("www.jasper.wang")   # 设定x轴的标签
ax[0][0].set_ylabel("www.jasper.wang")   # 设定y轴的标签
ax[0][0].set_xlim(1,x.max()*1.1)         # 设定x轴范围
ax[0][0].set_ylim(1,y.max()*1.1)         # 设定y轴范围
ax[0][0].set_xticks(range(1,11,2))       # 设定x轴的刻度
ax[0][0].set_yticks(range(1,1100,200))   # 设定y轴的刻度
ax[0][0].set_title('www.jasper.wang')
ax[0][0].grid(True)
ax[0][1].axis('off')                     # 隐藏第2个ax的坐标轴
ax[1][0].axis('off')                     # 隐藏第3个ax的坐标轴
plt.show()
嵌入式Axes,使用句柄 fig.add_axes([left, bottom, width, height])
#新建figure
fig = plt.figure()
# 定义数据
x = [1, 2, 3, 4, 5, 6, 7]
y = [1, 3, 4, 2, 5, 8, 6]

# 新建区域ax1
# figure的百分比,从figure 10%的位置开始绘制, 宽高是figure的80%
left, bottom, width, height = 0.1, 0.1, 0.8, 0.8
# 获得绘制的句柄
ax1 = fig.add_axes([left, bottom, width, height])
ax1.plot(x, y, 'r')
ax1.set_title('www.jasper.wang\n土豪哥我们做朋友吧', fontproperties=myfont)  # 植入硬广告

# 新增区域ax2, 嵌套在ax1内
left, bottom, width, height = 0.2, 0.5, 0.25, 0.25
# 获得绘制的句柄
ax2 = fig.add_axes([left, bottom, width, height])
ax2.plot(x,y, 'b')
ax2.set_title('www.jasper.wang\n土豪哥我们做朋友吧', fontproperties=myfont)  # 植入硬广告
# plt.title('jasper.wang')    # 针对当前axes,即ax2,配置title
plt.xticks([])                # 针对当前axes,即ax2,配置隐藏 x 坐标
plt.yticks([])                # 针对当前axes,即ax2,配置隐藏 y 坐标
plt.show()