

OpenLayer4——添加Geojson
Geojson是一种特殊的json数据,内部封装了地理空间相关的数据(点、线、面)。

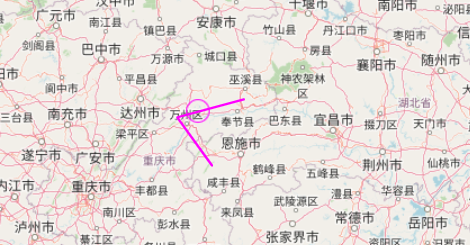
<!DOCTYPE html>
<html lang="en">
<head>
    <meta charset="UTF-8">
    <title>Title</title>
    <link href="ol/ol.css" rel="stylesheet" type="text/css"/>
    <script type="text/javascript" src="ol/ol.js" charset="utf-8"></script>
    <script type="text/javascript" src="ol/jquery-1.11.3.js" charset="utf-8"></script>
</head>
<body>
<div id="map" style="width: 100%;height: 100%"></div>
<button id="btn1">click</button>
<script>

    //设置一个点的样式
    var image = new ol.style.Circle({
        radius: 5,
        fill: null,
        stroke: new ol.style.Stroke({color: 'red', width: 1})
    });

    //给每一种样式的数据,添加一个默认的Style,添加geojson的时候,自动进行样式选择
    var styles = {
        'Point': new ol.style.Style({
            image: image
        }),
        'LineString': new ol.style.Style({
            stroke: new ol.style.Stroke({
                color: 'green',
                width: 1
            })
        }),
        'MultiLineString': new ol.style.Style({
            stroke: new ol.style.Stroke({
                color: 'green',
                width: 1
            })
        }),
        'MultiPoint': new ol.style.Style({
            image: image
        }),
        'MultiPolygon': new ol.style.Style({
            stroke: new ol.style.Stroke({
                color: 'yellow',
                width: 1
            }),
            fill: new ol.style.Fill({
                color: 'rgba(255, 255, 0, 0.1)'
            })
        }),

        'Polygon': new ol.style.Style({
            stroke: new ol.style.Stroke({
                color: 'blue',
                lineDash: [4],
                width: 3
            }),
            fill: new ol.style.Fill({
                color: 'rgba(0, 0, 255, 0.5)'
            })
        }),
        'GeometryCollection': new ol.style.Style({
            stroke: new ol.style.Stroke({
                color: 'magenta',
                width: 2
            }),
            fill: new ol.style.Fill({
                color: 'magenta'
            }),
            image: new ol.style.Circle({
                radius: 10,
                fill: null,
                stroke: new ol.style.Stroke({
                    color: 'magenta'
                })
            })
        }),
        'Circle': new ol.style.Style({
            stroke: new ol.style.Stroke({
                color: 'red',
                width: 2
            }),
            fill: new ol.style.Fill({
                color: 'rgba(255,0,0,0.2)'
            })
        })
    };

    // 测试用geojson
    // var geojsonObject = {
    //   "features": [{
    //     "geometry": {
    //       "coordinates": [[[97, 39.5], [97, 39.25], [102, 34.75], [105.25, 36], [105.25, 36.75], [104, 39.25], [98.25, 40], [98, 40], [97.75, 40], [97.5, 40], [97, 39.5]]],
    //       "type": "Polygon"
    //     }, "type": "Feature", "properties": {}
    //   }], "type": "FeatureCollection"
    // };

    // 测试用geojson
    var geojsonObject = {
        "features": [{
            "geometry": {
                "type": "GeometryCollection",
                "geometries": [
                    {
                        "type": "Point",
                        "coordinates": [108.62, 31.02819]
                    }, {
                        "type": "LineString",
                        "coordinates": [[108.896484375, 30.1071178870],
                            [108.2184375, 30.91717870],
                            [109.5184375, 31.2175780]]
                    }]
            }, "type": "Feature", "properties": {}
        }], "type": "FeatureCollection"
    };

    var vectorSource = new ol.source.Vector({
        //geojson转feature对象,将EPSG:4326坐标系修改为EPSG:3857(根据数据格式来)
        features: (new ol.format.GeoJSON({featureProjection: 'EPSG:3857'})).readFeatures(geojsonObject),
    });

    var vectorLayer = new ol.layer.Vector({
        source: vectorSource,
        style: function (feature) {
            return styles[feature.getGeometry().getType()];
        }
    });

    var map = new ol.Map({
        layers: [
            new ol.layer.Tile({
                source: new ol.source.OSM()
            }),
            vectorLayer
        ],
        target: 'map',
        view: new ol.View({
            //地图中心为117.2736, 31.8646,并把坐标投影转换为3857(web 墨卡托投影)
            center: ol.proj.transform([117.2736, 31.8646], 'EPSG:4326', 'EPSG:3857'),
            // 并且定义地图显示层级为5
            zoom: 5
        })
    });
</script>
</body>
</html>
疯狂的妞妞 :每一天,做什么都好,不要什么都不做!
分类:
openlayer4


【推荐】国内首个AI IDE,深度理解中文开发场景,立即下载体验Trae
【推荐】编程新体验,更懂你的AI,立即体验豆包MarsCode编程助手
【推荐】抖音旗下AI助手豆包,你的智能百科全书,全免费不限次数
【推荐】轻量又高性能的 SSH 工具 IShell:AI 加持,快人一步
· 开源Multi-agent AI智能体框架aevatar.ai,欢迎大家贡献代码
· Manus重磅发布:全球首款通用AI代理技术深度解析与实战指南
· 被坑几百块钱后,我竟然真的恢复了删除的微信聊天记录!
· 没有Manus邀请码?试试免邀请码的MGX或者开源的OpenManus吧
· 园子的第一款AI主题卫衣上架——"HELLO! HOW CAN I ASSIST YOU TODAY
2018-03-28 Shiro(一)——极简配置