SLAM中的NDT配准简介与使用
NDT方法
1.NDT方法理论基础
NDT(The Normal Distributions Transform)
正态分布概率密度函数
一元正态分布的密度函数表示为:
一元正态分布的似然函数为:
点击跳转具体推导 可在任何一本数理统计课本中查到、现在我们拓展到多元即含有X1,X2...Xp p个变量
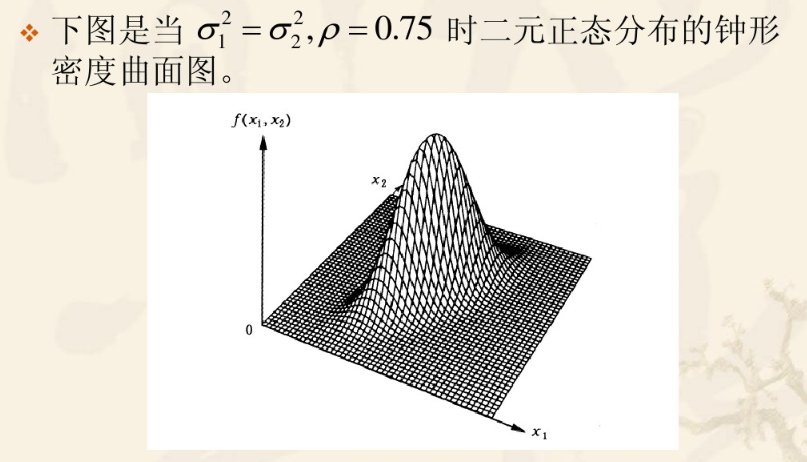
对于多元的情况有:

Similar to an occupancy grid, the NDT establishes aregular subdivision of the plane. But where the occupancy grid represents the probability of a cell being occupied, the NDT represents the probability of measuring a sample foreach position within the cell. We use a cell size of 100cm by 100 cm
与分配栅格类似,NDT建立了平面的细分区域。但是这里的栅格表示单元被占用的概率,NDT表示针对单元内每个位置测量样本的概率。我们使用100厘米乘100厘米的单元大小
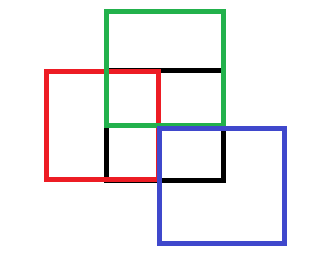
To minimize effects of discretization, we decided to usefour overlapping grids. That is, one grid with side lengthl of a single cell is placed first, then a second one, shifted by l/2 horizontally, a third one, shifted by l/2 vertically andfinally a fourth one, shifted by l/2 horizontally and verti-cally. Now each 2D point falls into four cells. This will notbe taken into account for the rest of the paper explicitlyand we will describe our algorithm, as if there were onlyone cell per point. So if the probability density of a pointis calculated, it is done with the tacit understanding, that the densities of all four cells are evaluated and the resultis summed up.
为了最小化离散化的影响,我们决定使用四个重叠的网格。也就是说,首先放置一个具有单个单元格的边长l的网格,然后放置第二个网格,水平偏移水平方向为l / 2,第三个网格,垂直偏移长度为l / 2,最后是第四个,水平偏移和垂直便宜长度均为l / 2。现在,每个2D点分为四个单元。在本文的其余部分中,不会明确考虑到这一点,我们将描述我们的算法,就像每个点只有一个像元一样。因此,如果计算出一个点的概率密度,则可以通过默认理解来完成,即评估所有四个单元的密度并将其结果相加。大概是这样
To prevent this effect, we check, whetherthe smaller eigenvalue of Σ is at least 0.001 times the larger eigenvalue. If not, it is set to this value
论文中为了避免非奇异还设定了一个阈值,即噪声要比协方差的0.001倍要小。
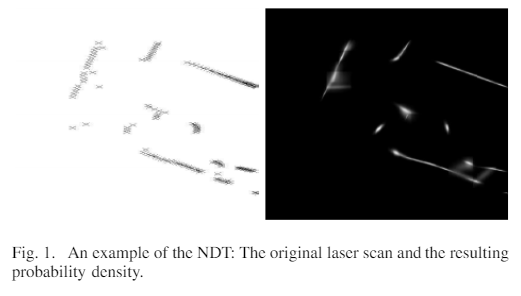
Fig. 1 shows an example laser scan and a visualizationof the resulting NDT. The visualization is created byevaluating theprobability density at each point, brightareas indicate high probability densities.
图1显示了激光扫描和所得NDT的可视化效果的例子。通过评估每个点的概率密度来创建可视化图像,明亮区域表示高概率密度。
两个机器人坐标系之间的空间映射T由下式给出
(tx,ty)t描述两个帧之间的平移和φ旋转。配准的目的是用两个位置扫描下的激光数据来恢复这些参数。给出两次扫描(第一和第二次扫描)后,用如下方法:
1)创建第一次扫描的NDT(参数化)。
2)初始化参数的估计值(用0或使用里程计数据)。
3)对于第二次扫描的每个样本:根据参数将构造的点映射到第一次扫描的坐标系中。
4)确定每个映射点的对应正态分布。
5)通过评估每个映射点的分布并求和结果来确定参数的分数。
6)优化计算新参数估计。通过最优化方法牛顿法完成。
7)转到3,直到满足收敛准则。
以上是配准 ***
下面是在建图中的应用
将全局参考坐标系作为机器人坐标系。在下文中,激光扫描数据称为关键帧。对关键帧进行轨迹描述。在时间tk内,算法执行以下步骤
1)假设δ是时间tk-1和tk之间的运动的估计(如来自里程表的运动估计)。
2)由δ推出tk-1的位置估计。
3)使用现有帧进行ndt配准,得到新的位置估计。
4)检查关键帧是否足够接近于当前帧c。是则进行1-4迭代。否则,将最近一次成功匹配的扫描作为新的关键帧。
我们将地图定义为关键帧和姿态的集合。当机器人到达未知地区时如何在地图中进行定位,如何扩展地图、优化地图。
当前机器人姿态由旋转矩阵R和平移矢量T表示。从机器人坐标系到第i次扫描全局坐标系的映射关系如下:
slam问题中包含定位和建图对于定位:
对机器人每个位置的扫描数据,评估概率密度结果的大小来定位。
对于建图:
若这一帧跟每一帧即每个位置的扫描数据均匹配度较小,则用最近匹配正确的那一帧来继续用上述NDT方法建图。
In this graph, every keyframe is represented by a node.A node holds the estimate for the pose of the keyframein the global coordinate frame. An edge between twonodes indicates that the corresponding scans have beenpairwise matched and holds the relative pose between thetwo scans.
在图中,每个关键帧均由一个节点表示。节点在全局坐标系中保存关键帧的姿态估计值。两个节点之间的边表示相应的扫描已匹配,并保存了两帧间的相对位姿。(此处是图优化部分的内容 可以跳转高翔博士的博客图优化) 最后可用最化理论给其添边。
以上来自论文NDT原创者论文
中文部分是加了自己理解之后的东西,英文部分是原作者的话。
后面附ndt调用及初始化的源码
1.NDT方法应用
其应用相对来说比较简单,pcl中有对应的库
初始化参数设置工作
pcl::NormalDistributionsTransform<pcl::PointXYZ, pcl::PointXYZ> ndt_new;//初始化
ndt_new.setTransformationEpsilon(trans_epsilon);//设置收敛 0.1- 0.001
ndt_new.setStepSize(step_size);//设置步长 0.1
ndt_new.setResolution(resolution);//设置栅格化大小1-2m最佳
ndt_new.setMaximumIterations(max_iterations);//最大迭代步数50-200
ndt_new.setInputTarget(set_InputTarget);//配准的目标 对准的目标
ndt_newer.setInputSource(set_InputSource);//配准的输入 对准的输入
ndt_newer.align(*transform_points, initial_pose_matrix);//赋初值
结果获取
Eigen::Matrix4f result_pose_matrix = ndt_newer.getFinalTransformation();//四元数矩阵 位姿变换矩阵
transform_probability = ndt_newer.getTransformationProbability();//概率


