5.线性回归算法
1.本节重点知识点用自己的话总结出来,可以配上图片,以及说明该知识点的重要性
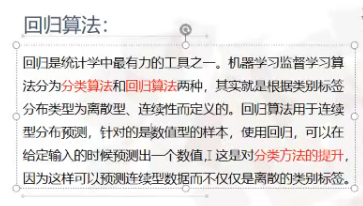
回归算法概述:
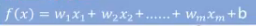
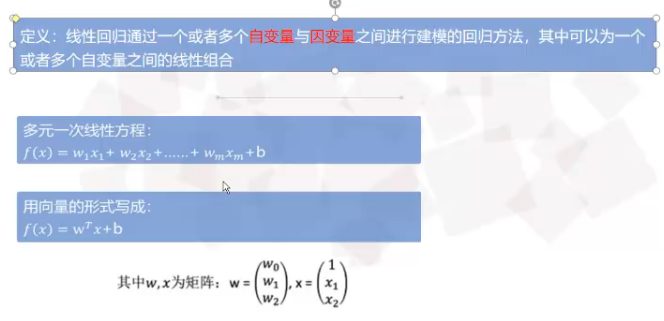
线性关系模型:
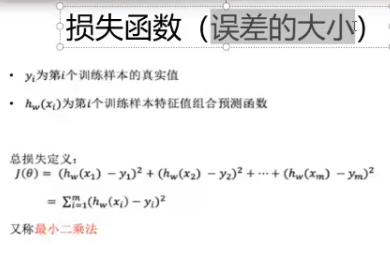
机器学习与真实值也是又一定误差的:
2.思考线性回归算法可以用来做什么?(大家尽量不要写重复)
线性回归算法可以用来对数据进行统计并分析出一个走势。
例如可以根据数据来评估电影的票房,房价的预测,判断个人信用度等。
3.自主编写线性回归算法 ,数据可以自己造,或者从网上获取。(加分题)
代码:
import numpy as np
import matplotlib.pyplot as plt
from sklearn.linear_model import LinearRegression
# 样本数据集[x,y]
data = [
[0.067732, 3.176513], [0.427810, 3.816464], [0.995731, 4.550095], [0.738336, 4.256571], [0.981083, 4.560815],
[0.526171, 3.929515], [0.378887, 3.526170], [0.033859, 3.156393], [0.132791, 3.110301], [0.138306, 3.149813],
[0.247809, 3.476346], [0.648270, 4.119688], [0.731209, 4.282233], [0.236833, 3.486582], [0.969788, 4.655492],
[0.607492, 3.965162], [0.358622, 3.514900], [0.147846, 3.125947], [0.637820, 4.094115], [0.230372, 3.476039],
[0.070237, 3.210610], [0.067154, 3.190612], [0.925577, 4.631504], [0.717733, 4.295890], [0.015371, 3.085028],
[0.335070, 3.448080], [0.040486, 3.167440], [0.212575, 3.364266], [0.617218, 3.993482], [0.541196, 3.891471]
]
# 生成x,y矩阵
dataMat = np.array(data)
x = dataMat[:, 0:1] # 变量x
y = dataMat[:, 1] # 变量y
#线性回归
model = LinearRegression(copy_X=True, fit_intercept=True, n_jobs=1, normalize=False)
# 线性回归建模
model.fit(x, y)
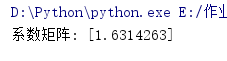
print('系数矩阵:\n', model.coef_)
# 模型预测
predicted = model.predict(x)
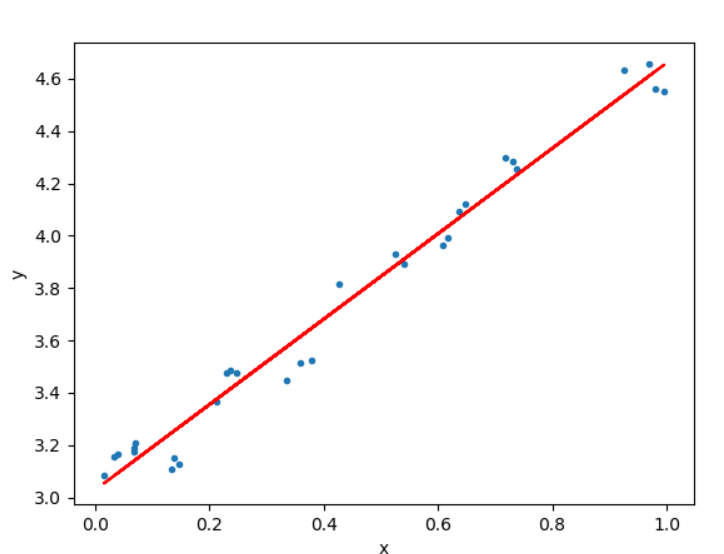
# 画图
plt.scatter(x, y, marker='.')
plt.plot(x, predicted, c='r')
plt.xlabel("x")
plt.ylabel("y")
plt.show()


 浙公网安备 33010602011771号