canvas学习笔记(下篇) -- canvas入门教程--保存状态/变形/旋转/缩放/矩阵变换/综合案例(星空/时钟/小球)
【下篇】 -- 建议学习时间4小时 课程共(上中下)三篇
此笔记是我初次接触canvas的时候的学习笔记,这次特意整理为博客供大家入门学习,几乎涵盖了canvas所有的基础知识,并且有众多练习案例,建议大家学习10~15个小时,里面的案例请挨个敲一遍,这样才能转化为自己的知识。
技术要求:有html/css/js基础。
保存状态
save()restore()
save 和 restore 方法是用来保存和恢复 canvas 状态的,都没有参数。Canvas 的状态就是当前画面应用的所有样式和变形的一个快照。
简单示例:
        var c = document.getElementById("myCanvas");
        var ctx = c.getContext("2d");

        //线条链接处样式
        ctx.fillStyle = "darkblue";
        ctx.lineWidth = 1;

        ctx.fillRect(0,0,150,150);
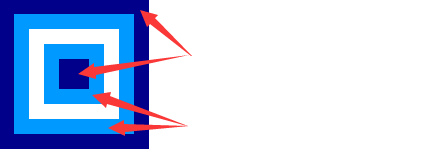
        ctx.save();    //第一次保存 保存了  fillStyle "darkblue"

        ctx.fillStyle = "#09f";
        ctx.fillRect(15,15,120,120);

        ctx.save();    //第二次保存 保存了  fillStyle "#09f"
        ctx.fillStyle = "#fff";
        ctx.fillRect(30,30,90,90);

        ctx.restore();  //恢复到第二次保存的状态
        ctx.fillRect(45,45,60,60);

        ctx.restore();  //恢复到第一次保存的状态
        ctx.fillRect(60,60,30,30);
结果如下图:后两次 restore之后依次恢复到前面 save的颜色状态
画布变形
偏移
ctx.translate(disX,disY) ,将绘图上下文向x和y方向移动一个距离,然后再作画 (真实的画布并没有移动)
示例:
        var c = document.getElementById("myCanvas");
        var ctx = c.getContext("2d");

        /* 移动位置 */
        ctx.fillRect(0,0,50,50);

        ctx.translate(100,100); //将画布x,y方向分别移动 100px

        ctx.fillStyle = "#09f";
        ctx.fillRect(0,0,50,50);
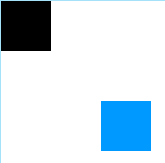
这里我们可以看到,虽然绘制都是使用 fillRect(0,0,5.,50),但第二次绘制的时候上下文已经偏移了 100像素,所以落到画布上的时候就偏移了100像素
旋转
rotate(angle)
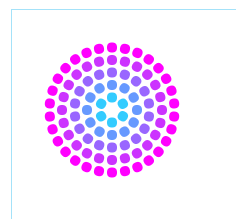
这个方法只接受一个参数:旋转的角度(angle),它是顺时针方向的,以弧度为单位的值。
示例:
        var c = document.getElementById("myCanvas");
        var ctx = c.getContext("2d");

        ctx.translate(100,100);

        for(var i=1; i<6; i++){
            ctx.save();
            ctx.fillStyle = 'rgba('+ 51*i +','+ (255-51*i) +',255,1)';
            for(var j=0; j<i*6; j++){
                ctx.rotate(Math.PI*2/(i*6));
                ctx.beginPath();
                ctx.arc(0,i*12.5,5,0,Math.PI*2,true);
                ctx.fill();
            }
            ctx.restore()
        }
缩放
scale(x, y)
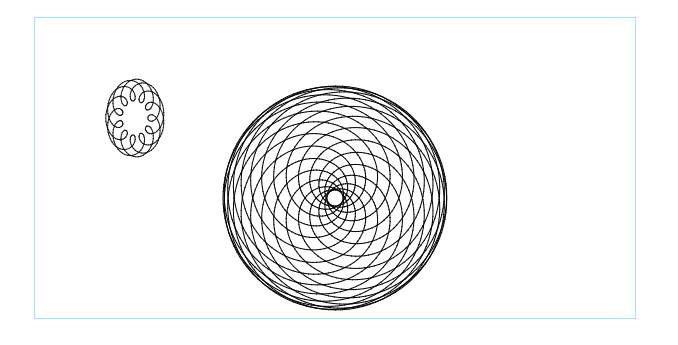
scale 方法接受两个参数。x,y 分别是横轴和纵轴的缩放因子,它们都必须是正值。值比 1.0 小表示缩小,比 1.0 大则表示放大,值为 1.0 时什么效果都没有。
示例:
        var c = document.getElementById("myCanvas");
        var ctx = c.getContext("2d");

        ctx.translate(100,100);

        ctx.save();
        ctx.translate(200,80);
        drawSpirograph(ctx,22,30,30);
        ctx.restore();
        ctx.scale(0.75,1);
        drawSpirograph(ctx,22,6,5);

        function drawSpirograph(ctx,R,r,O){
            var x1 = R-O;
            var y1 = 0;
            var i  = 1;
            ctx.beginPath();
            ctx.moveTo(x1,y1);
            do {
                if (i>20000) break;
                var x2 = (R+r)*Math.cos(i*Math.PI/72) - (r+O)*Math.cos(((R+r)/r)*(i*Math.PI/72))
                var y2 = (R+r)*Math.sin(i*Math.PI/72) - (r+O)*Math.sin(((R+r)/r)*(i*Math.PI/72))
                ctx.lineTo(x2,y2);
                x1 = x2;
                y1 = y2;
                i++;
            } while (x2 != R-O && y2 != 0 );
            ctx.stroke();
        }
矩阵变换
transform(m11, m12, m21, m22, dx, dy)
这个方法是将当前的变形矩阵乘上一个基于自身参数的矩阵,在这里我们用下面的矩阵:
m11 m21 dx
m12 m22 dy
0 0 1
这个函数的参数各自代表如下:
m11:水平方向的缩放
m12:水平方向的偏移
m21:竖直方向的偏移
m22:竖直方向的缩放
dx:水平方向的移动
dy:竖直方向的移动
示例:
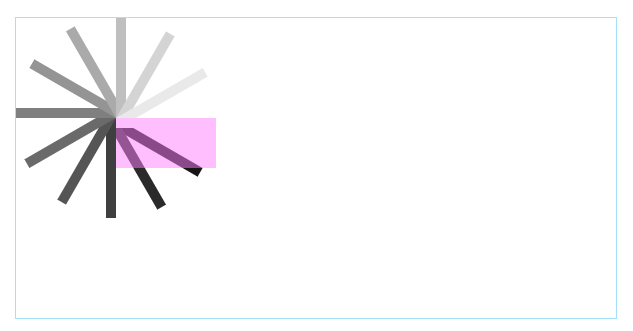
        var c = document.getElementById("myCanvas");
        var ctx = c.getContext("2d");

        ctx.translate(100,100);

        var sin = Math.sin(Math.PI/6);
        var cos = Math.cos(Math.PI/6);
        var c = 0;
        for(var i=0; i<=12; i++){
            c = Math.floor(255/12*i);
            ctx.fillStyle = "rgb("+c+","+c+","+c+")";
            ctx.fillRect(0,0,100,10);
            ctx.transform(cos,sin,-sin,cos,0,0);
        }
        ctx.setTransform(1,0,0,1,100,100);
        ctx.fillStyle = "rgba(255,128,255,0.5)";
        ctx.fillRect(0,0,100,50);
综合案例
案例1:星空

<!DOCTYPE html>
<html>
<head lang="en">
    <meta charset="UTF-8">
    <title></title>
    <style>
        *{margin: 0;padding: 0}
        canvas{border: 1px solid #a4e2f9;margin: 10px;}
    </style>
</head>
<body>
    <canvas height="300" width="600" id="myCanvas"></canvas>
    <script>
        var c = document.getElementById("myCanvas");
        var ctx = c.getContext("2d");

        //线条链接处样式
        ctx.strokeStyle = "#09f";
        ctx.lineWidth = 1;

        ctx.fillRect(0,0,450,450);
        ctx.translate(150,150);

        ctx.beginPath();
        ctx.arc(0,0,140,0,Math.PI*2,true);
        ctx.clip();  //这个表示裁剪,只有路径区域中的部分才可见。

        var lingrad = ctx.createLinearGradient(0,-175,0,250);
        lingrad.addColorStop(0,"#232256");
        lingrad.addColorStop(1,"#143778");

        //绘制渐变背景
        ctx.fillStyle = lingrad;
        ctx.fillRect(-175,-175,350,350);

        //绘制星星
        for(var j=1; j<100; j++){
            ctx.save();
            ctx.fillStyle = "#fff";
            ctx.translate(140-Math.floor(Math.random()*280),140-Math.floor(Math.random()*280));
            drawStar(ctx, Math.floor(Math.random()*8)+2);
            ctx.restore();
        }

        //绘制星星的方法
        function drawStar(ctx,r){
            ctx.save();
            ctx.beginPath();
            ctx.moveTo(r,0);
            for(var i=0; i<9; i++){
                ctx.rotate(Math.PI/5);
                if(i%2 == 0){
                    ctx.lineTo((r/0.525731)*0.200811,0);
                }else{
                    ctx.lineTo(r,0);
                }
            }
            ctx.closePath();
            ctx.fill();
            ctx.restore();
        }

    </script>
</body>
</html>
案例2:时钟

<!DOCTYPE html>
<html>
<head lang="en">
    <meta charset="UTF-8">
    <title></title>
    <style>
        *{margin: 0;padding: 0}
        canvas{border: 1px solid #a4e2f9;margin: 30px auto;display: block}

    </style>
</head>
<body>
    <canvas height="300" width="600" id="myCanvas"></canvas>

    <script>

        function clock(){
            var now = new Date();
            var ctx = document.getElementById('myCanvas').getContext('2d');
            ctx.save();
            ctx.clearRect(0,0,150,150);
            ctx.translate(75,75);
            ctx.scale(0.4,0.4);
            ctx.rotate(-Math.PI/2);
            ctx.strokeStyle = "black";
            ctx.fillStyle = "white";
            ctx. lineWidth = 8;
            ctx.lineCap = "round";

            //时
            ctx.save();
            for(var i=0; i<12; i++){
                ctx.beginPath();
                ctx.rotate(Math.PI/6);
                ctx.moveTo(100,0);
                ctx.lineTo(120,0);
                ctx.stroke();
            }
            ctx.restore();

            //分
            ctx.save();
            ctx.lineWidth = 5;
            for(var i=0; i<60; i++){
                if(i%5 != 0){
                    ctx.beginPath();
                    ctx.moveTo(117,0);
                    ctx.lineTo(120,0);
                    ctx.stroke();
                }

                ctx.rotate(Math.PI/30);

            }
            ctx.restore();

            var sec = now.getSeconds();
            var min = now.getMinutes();
            var hr = now.getHours();
            hr = hr >= 12 ? hr-12 : hr;

            ctx.fillStyle = "black";

            //时针
            ctx.save();
            ctx.rotate(  hr*(Math.PI/6)+(Math.PI/360)*min+(Math.PI/21600)*sec  );
            ctx.lineWidth = 14;
            ctx.beginPath();
            ctx.moveTo(-20,0);
            ctx.lineTo(80,0);
            ctx.stroke();
            ctx.restore();

            //分针
            ctx.save();
            ctx.rotate(  (Math.PI/30)*min+(Math.PI/1800)*sec  );
            ctx.lineWidth = 10;
            ctx.beginPath();
            ctx.moveTo(-20,0);
            ctx.lineTo(112,0);
            ctx.stroke();
            ctx.restore();


            //秒针
            ctx.save();
            ctx.rotate(  (Math.PI/30)*sec );
            ctx.strokeStyle = "#D40000";
            ctx.fillStyle = "#D40000";
            ctx.lineWidth = 6;
            ctx.beginPath();
            ctx.moveTo(-30,0);
            ctx.lineTo(83,0);
            ctx.stroke();

            ctx.beginPath();
            ctx.arc(0,0,10,0,Math.PI*2,true);
            ctx.fill();

            ctx.beginPath();
            ctx.arc(95,0,10,0,Math.PI*2,true);
            ctx.stroke();


            ctx.restore();

            //外圈
            ctx.beginPath();
            ctx.lineWidth = 14;
            ctx.strokeStyle = '#325FA2';
            ctx.arc(0,0,142,0,Math.PI*2,true);
            ctx.stroke();

            ctx. restore();

            window.requestAnimationFrame(clock);
        }

        window.requestAnimationFrame(clock);

    </script>
</body>
</html>
案例3:运动的小球

<!DOCTYPE html>
<html>
<head lang="en">
    <meta charset="UTF-8">
    <title></title>
    <style>
        *{margin: 0;padding: 0}
        canvas{border: 1px solid #a4e2f9;}

    </style>
</head>
<body>
    <canvas height="300" width="600" id="myCanvas"></canvas>

    <script>

        var canvas = document.getElementById('myCanvas');
        var ctx = canvas.getContext('2d');
        var raf;

        //小球对象
        var ball = {
            x: 100,
            y: 100,
            vx: 5,
            vy: 1,
            radius: 25,
            color: '#1895c3',
            draw: function() {
                ctx.beginPath();
                ctx.arc(this.x, this.y, this.radius, 0, Math.PI*2, true);
                ctx.closePath();
                ctx.fillStyle = this.color;
                ctx.fill();
            }
        };

        //清除画布
        function clear() {
            ctx.fillStyle = 'rgba(255,255,255,0.3)';
            ctx.fillRect(0,0,canvas.width,canvas.height);
        }

        //小球运动及绘制的方法
        function draw() {
            clear();
            ball.x += ball.vx;
            ball.y += ball.vy;

            if (ball.y + ball.vy > canvas.height || ball.y + ball.vy < 0) {
                ball.vy = -ball.vy;
            }
            if (ball.x + ball.vx > canvas.width || ball.x + ball.vx < 0) {
                ball.vx = -ball.vx;
            }

            ball.draw();
            raf = window.requestAnimationFrame(draw);
        }

        //鼠标移动的时候 让小球跟着鼠标走
        canvas.addEventListener('mousemove', function(e){
            clear();
            ball.x = e.clientX;
            ball.y = e.clientY;
            ball.draw();
        });

        //鼠标移入停止动画
        canvas.addEventListener("mouseenter",function(e){
            window.cancelAnimationFrame(raf);
        });

        //鼠标移出继续动画
        canvas.addEventListener("mouseout",function(e){
            raf = window.requestAnimationFrame(draw);
        });

        //开始第一帧动画
        draw();

    </script>
</body>
</html>
今天就讲到这里,canvas基础部分就结束了,后续会找时间更新一些canvas比较炫酷的综合案例,请期待。
关注公众号,博客更新即可收到推送


【推荐】还在用 ECharts 开发大屏?试试这款永久免费的开源 BI 工具!
【推荐】国内首个AI IDE,深度理解中文开发场景,立即下载体验Trae
【推荐】编程新体验,更懂你的AI,立即体验豆包MarsCode编程助手
【推荐】轻量又高性能的 SSH 工具 IShell:AI 加持,快人一步