
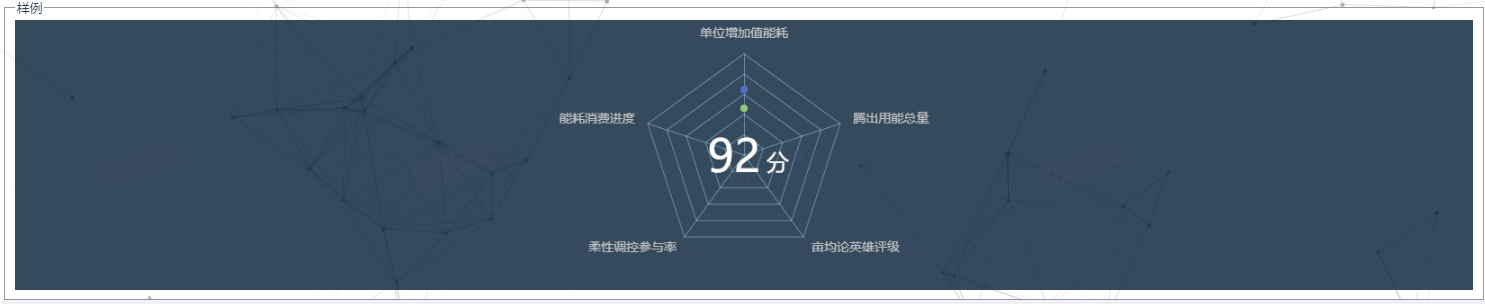
6.雷达图
<template>
  <div>
    <div ref="chart1" class="chart"></div>
  </div>
</template>
<script>
import * as echarts from "echarts";
export default {
  data() {
    return {
      chartOption: {
        backgroundColor: "rgba(3,29,51,0.8)",
        tooltip: {},
        title: [
          {
            text: 92,
            left: "49%",
            top: "42%",
            textAlign: "center",
            textStyle: {
              fontSize: "50",
              fontWeight: "400",
              color: "#fff",
              textAlign: "center"
            }
          },
          {
            text: "分",
            left: "52%",
            top: "47.5%",
            textAlign: "center",
            textStyle: {
              fontSize: "25",
              fontWeight: "400",
              color: "#fff",
              textAlign: "center"
            }
          },
          // {
          //   subtext: "限电轮次" ,
          //   left: "50%",
          //   top: "51%",
          //   textAlign: "center",
          //   subtextStyle: {
          //     fontSize: "15",
          //     fontWeight: "400",
          //     color: "#fff",
          //     textAlign: "center"
          //   }
          // }
        ],
        radar: {
          name: {
            textStyle: {
              color: "#c1c3c4",
              fontSize: 14
            }
          },
          indicator: [
            { name: "单位增加值能耗", max: 6500 },
            { name: "能耗消费进度", max: 6000 },
            { name: "柔性调控参与率", max: 30000 },
            { name: "亩均论英雄评级", max: 38000 },
            { name: "腾出用能总量", max: 52000 }
          ],
          axisLine: {
            lineStyle: {
              color: "rgba(153, 209, 246, 0.5)" // 轴线颜色
            }
          },
          splitArea: {
            show: false,
            areaStyle: {
              color: "rgba(255,0,0,0)" // Rader图背景颜色
            }
          },
          splitLine: {
            show: true,
            lineStyle: {
              width: 1,
              color: "rgba(153, 209, 246, 0.5)" // 网格分割线颜色
            }
          }
        },
        series: [
          {
            name: "柔性调控评价",
            type: "radar",
            data: [
              {
                value: [],
                areaStyle: {
                  color: "rgba(64, 158, 255, 0.2)"
                },
                itemStyle: {
                  normal: {
                    color: "#c8eeff",
                    borderColor: "#2cc1fa"
                  }
                },
                lineStyle: {
                  color: "rgba(146, 225, 255, 1)",
                  width: 1
                }
              }
            ]
          }
        ]
      }
    };
  },
  async mounted() {
    const chart = echarts.init(this.$refs.chart1);
    chart.setOption(this.chartOption);
    await this.fetchData();
  },
  methods: {
    async fetchData() {
      //获取接口数据
      let series1 = [4200, 3000, 20000, 35000, 50000, 18000];
      //将数据渲染到echarts图
        const chart = echarts.init(this.$refs.chart1);
        chart.setOption({
          series: [{ data: series1 }]
        });
    }
  }
};
</script>
<style scoped lang="scss">
.chart {
  width: 100%;
  height: 300px;
}
</style>
转载请注明原文链接:https://www.cnblogs.com/chenJieLing/

 浙公网安备 33010602011771号