

knit样式 + ggplot 样式
改pdf引擎
output:
pdf_document:
latex_engine: xelatex
knit
{r setup, include=FALSE} knitr::opts_chunk$set(echo = TRUE) knitr::opts_chunk$set(warning = FALSE, message = FALSE) knitr::opts_chunk$set(tidy = TRUE, tidy.opts = list(width.cutoff = 60)) library(tidyverse) library(knitr)
ggplot
老师要求
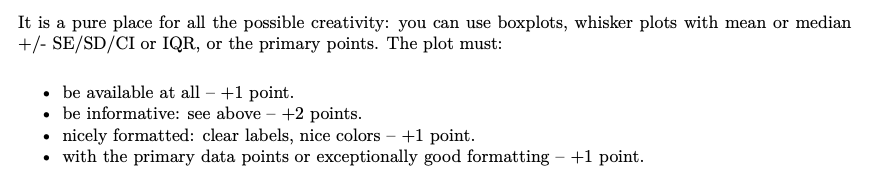
标题肯定要的,xy轴也必须重命名成清楚的,带上单位
箱线图案例
# Load the ggplot2 package if (!require("ggplot2")) install.packages("ggplot2") library(ggplot2) # Create sample data set.seed(123) # Set a random seed for reproducibility data <- data.frame( Category = rep(c("A", "B", "C"), each = 100), Value = c(rnorm(100, mean = 10, sd = 2), rnorm(100, mean = 12, sd = 3), rnorm(100, mean = 8, sd = 1)) ) # Create a boxplot using ggplot2 ggplot(data, aes(x = Category, y = Value)) + geom_boxplot() + # Add boxplot layer geom_point(position = position_jitter(width = 0.2), color = "blue") + # Add jittered points layer to show raw data labs(title = "Example Boxplot with ggplot2", # Set the chart title x = "Categories", # Set the x-axis label y = "Values") + # Set the y-axis label theme_minimal() + # Use a minimalist theme theme(axis.text.x = element_text(angle = 45, hjust = 1), # Rotate x-axis labels for better readability plot.title = element_text(hjust = 0.5)) + # Center the title scale_y_continuous(breaks = seq(0, 15, by = 2)) + # Set y-axis tick marks scale_color_brewer(palette = "Pastel1") + # Use a color brewer palette for points theme(plot.background = element_rect(fill = "gray95"), # Set the plot background color axis.line = element_line(color = "black"), # Set axis line color panel.grid.major = element_line(color = "gray80"), # Set major grid line color panel.grid.minor = element_line(color = "gray90")) # Set minor grid line color


【推荐】国内首个AI IDE,深度理解中文开发场景,立即下载体验Trae
【推荐】编程新体验,更懂你的AI,立即体验豆包MarsCode编程助手
【推荐】抖音旗下AI助手豆包,你的智能百科全书,全免费不限次数
【推荐】轻量又高性能的 SSH 工具 IShell:AI 加持,快人一步
· TypeScript + Deepseek 打造卜卦网站:技术与玄学的结合
· Manus的开源复刻OpenManus初探
· AI 智能体引爆开源社区「GitHub 热点速览」
· C#/.NET/.NET Core技术前沿周刊 | 第 29 期(2025年3.1-3.9)
· 从HTTP原因短语缺失研究HTTP/2和HTTP/3的设计差异