###########sample 1
https://www.cnblogs.com/hanshanxiaoheshang/p/10304672.html (不错)
如何从zabbix server 数据库端获取数据。
3、zabbix配置入门
Zabbix模板
zabbix组件:
zabbix-server
zabbix-database
zabbix-web
zabbix-agent
zabbix-proxy
zabbix逻辑组件:
主机组、主机
item(监控项)、appliction(应用)
graph(图形)
trigger(触发器)
event(事件)
action
notice
command
media
users(meida)
监控系统四种功能:
数据采集、数据存储、报警、数据可视化
zabbix安装过程:
server端:database(创建zabbix数据库和zbxuser用户) --> zabbix-server (zabbix_server.conf、把数据导入到database) --> zabbix-web(LAMP平台、启动httpd服务器)
--> http://zabbix-web-server/zabbix(在浏览器中实现zabbix配置)
agent端:zabbix-agent (zabbix-agent)
如何不依赖templates手动创建items来实现监控项?
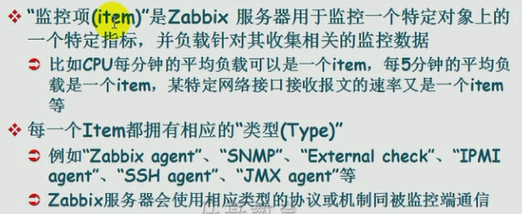
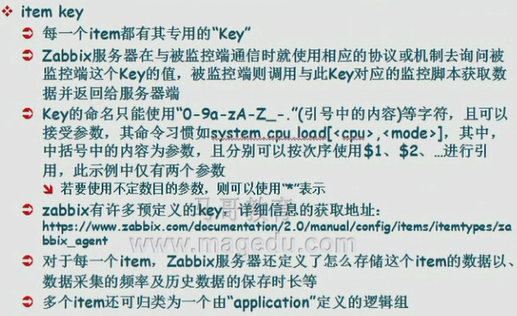
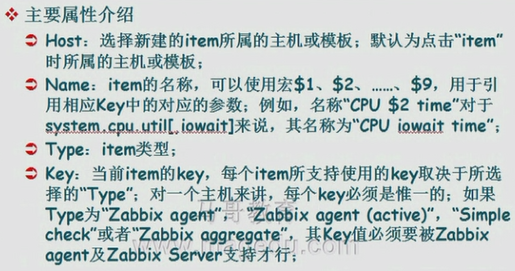
获取item的key列表:
1、在zabbix官方文档获取
https://www.zabbix.com/documentation/4.0/manual/config/items/itemtypes/zabbix_agent
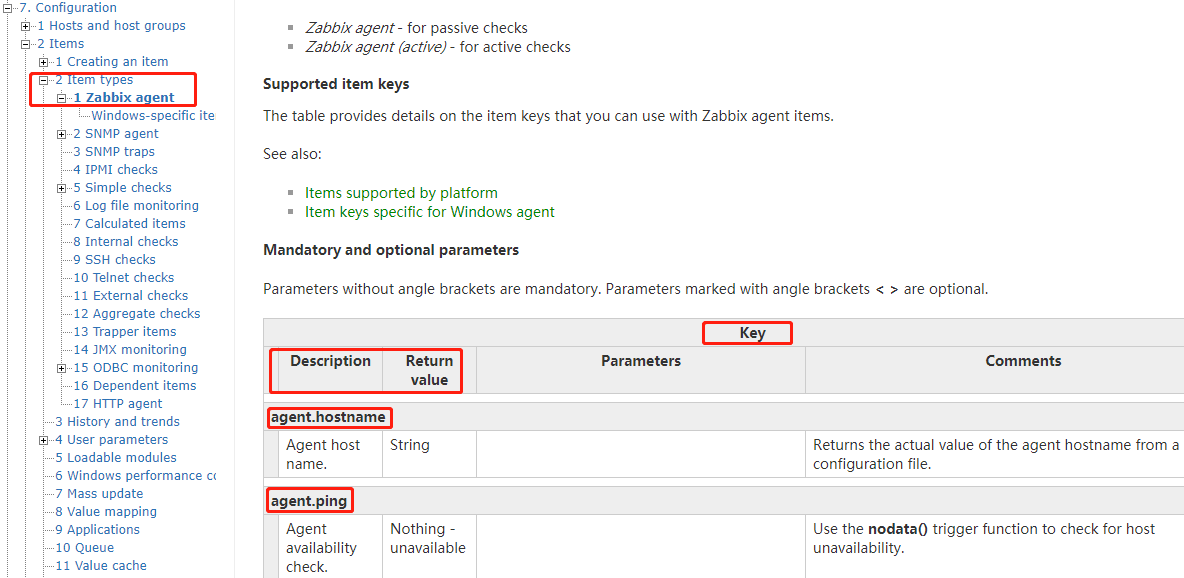
2、查询MySQL数据库
# mysql
> use zabbix;
MariaDB [zabbix]> select * from items\G;
*************************** 766. row ***************************
itemid: 25430
type: 0
snmp_community:
snmp_oid:
hostid: 10106
name: Used disk space on $1 //key名称
key_: vfs.fs.size[/boot,used] //key......
MariaDB [zabbix]> select key_,type from items; //查找key_名称和key的类型
+---------------------------------------------------------------------------------+------+
| key_                                                                            | type |
+---------------------------------------------------------------------------------+------+
| proc.num[]    //key名称                                                          |    0 |   //key类型,比如0是编号,这个编号对应的有名称,是在另一个表上存储的
| system.cpu.load[percpu,avg1]                                                    |    0 |   //type为0的一般是由zabbix-agent提供的
| zabbix[wcache,history,pfree]                                                    |    5 |
| zabbix[wcache,trend,pfree]                                                      |    5 |
| zabbix[wcache,values]                                                           |    5 |
| hrStorageSizeInBytes[{#SNMPVALUE}]                                              |   15 |
| hrStorageUsedInBytes[{#SNMPVALUE}]                                              |   15 |
| hrStorageSizeInBytes[{#SNMPVALUE}]                                              |   15 |
| hrStorageUsedInBytes[{#SNMPVALUE}]                                              |   15 |
| hrStorageUsed[{#SNMPVALUE}]                                                     |    4 |
| sysContact                                                                      |    4 |
| hrProcessorLoad[{#SNMPINDEX}]                                                   |    4 |
| bb_1.8v_sm                                                                      |   12 |
| bb_3.3v                                                                         |   12 |
| bb_3.3v_stby                                                                    |   12 |
# zabbix_get -h //以手动的方式用命令向指定的zabbix agent主机获取某一指定key的值
usage:
  zabbix_get -s host-name-or-IP [-p port-number] [-I IP-address] -k item-key
  zabbix_get -s host-name-or-IP [-p port-number] [-I IP-address]
                --tls-connect cert --tls-ca-file CA-file
                [--tls-crl-file CRL-file] [--tls-agent-cert-issuer cert-issuer]
                [--tls-agent-cert-subject cert-subject]
                --tls-cert-file cert-file --tls-key-file key-file -k item-key
  zabbix_get -s host-name-or-IP [-p port-number] [-I IP-address]
                --tls-connect psk --tls-psk-identity PSK-identity
                --tls-psk-file PSK-file -k item-key
  zabbix_get -h
  zabbix_get -V

Example(s):
  zabbix_get -s 127.0.0.1 -p 10050 -k "system.cpu.load[all,avg1]"

  zabbix_get -s 127.0.0.1 -p 10050 -k "system.cpu.load[all,avg1]" \
    --tls-connect cert --tls-ca-file /home/zabbix/zabbix_ca_file \
    --tls-agent-cert-issuer \
    "CN=Signing CA,OU=IT operations,O=Example Corp,DC=example,DC=com" \
    --tls-agent-cert-subject \
    "CN=server1,OU=IT operations,O=Example Corp,DC=example,DC=com" \
    --tls-cert-file /home/zabbix/zabbix_get.crt \
    --tls-key-file /home/zabbix/zabbix_get.key

  zabbix_get -s 127.0.0.1 -p 10050 -k "system.cpu.load[all,avg1]" \
    --tls-connect psk --tls-psk-identity "PSK ID Zabbix agentd" \
    --tls-psk-file /home/zabbix/zabbix_agentd.psk

Report bugs to: <https://support.zabbix.com>
Zabbix home page: <http://www.zabbix.com>
Documentation: <https://www.zabbix.com/documentation>
[root@node1 ~]# zabbix_get -s 192.168.128.132 -k "system.uname" //从server端获取指定IP的agent端的主机名,只要指定IP的主机上安装了 //zabbix-agent程序包,type为0大多数key都是支持调用的
Linux node2 3.10.0-693.el7.x86_64 #1 SMP Tue Aug 22 21:09:27 UTC 2017 x86_64 //-p指定端口,如果是默认的可以省略
[root@node1 ~]# zabbix_get -s 192.168.128.132 -k "net.if.in[ens33]" //[]表示传递参数,表示网卡的流出量
18237565
[root@node1 ~]# zabbix_get -s 192.168.128.132 -k "net.if.out[ens33]" //表示网卡的流进量
8821605
在监控定义时每一个key所定义的内容就是一个item,表示这个item是用来监控什么内容的。
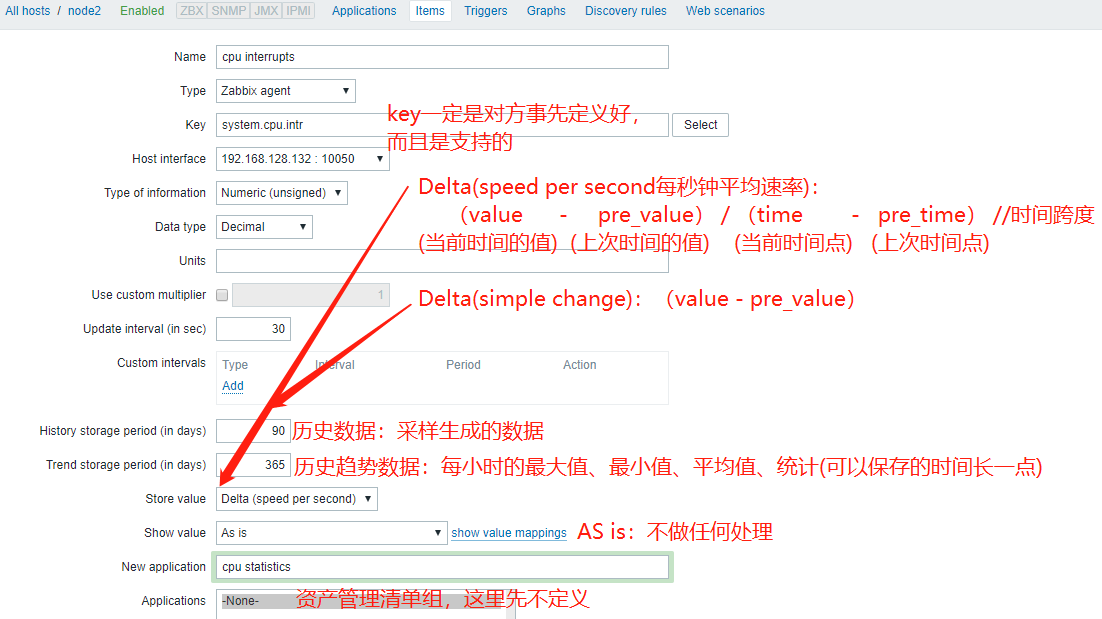
创建key的流程:Configuration --> Host --> 对应的host上选择item --> create item --> 提供参数

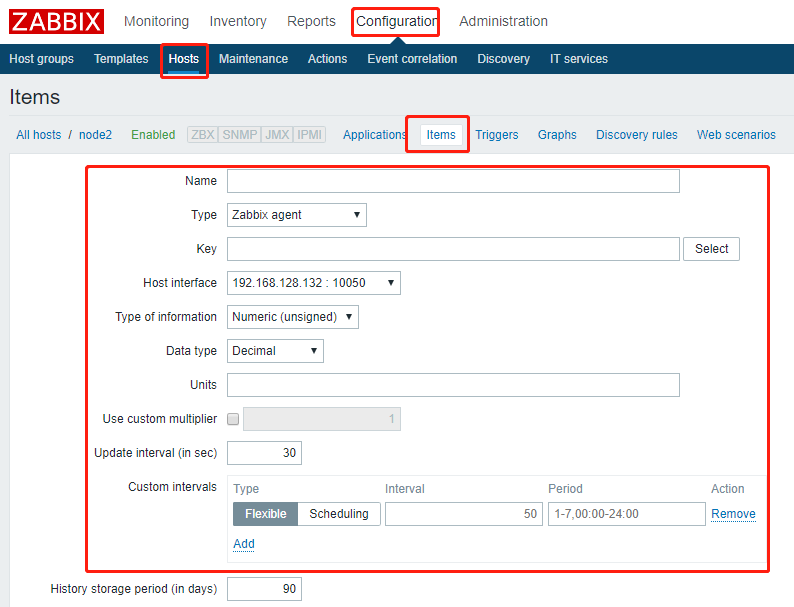
从数据库中获取item的name
MariaDB [zabbix]> select key_,type from items where key_ like 'system.cpu%'; //可以获取关于cpu的item名称
MariaDB [zabbix]> show tables; //定义好items后,可以在mysql中查看表history
MariaDB [zabbix]> select * from history;
创建Trigger

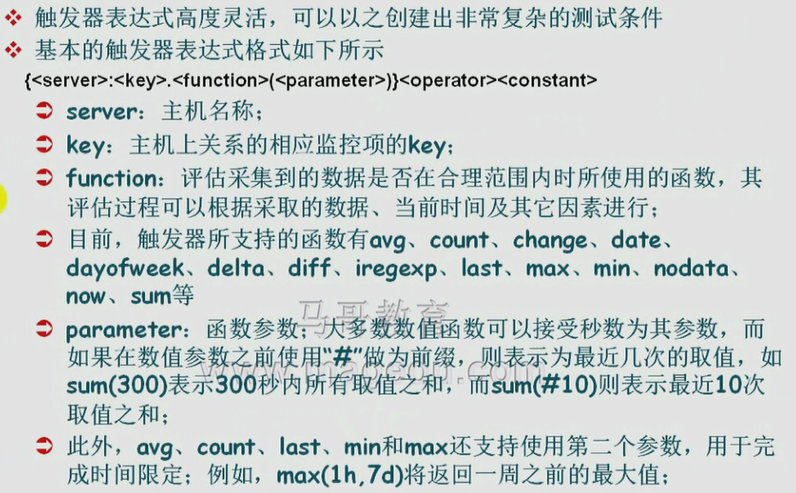
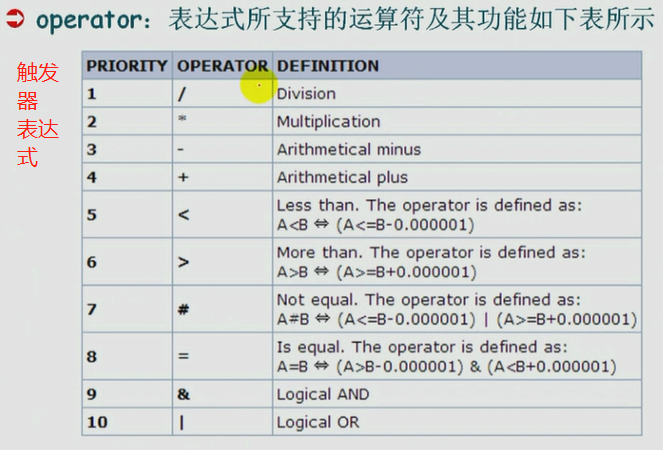

{wwww.magedu.com:system.cpu.load[all,avg1].last(0)}>3
//wwww.magedu.com 表主机
//system.cpu.load 表key,key是可以接受参数的,all,avg1表示key的参数

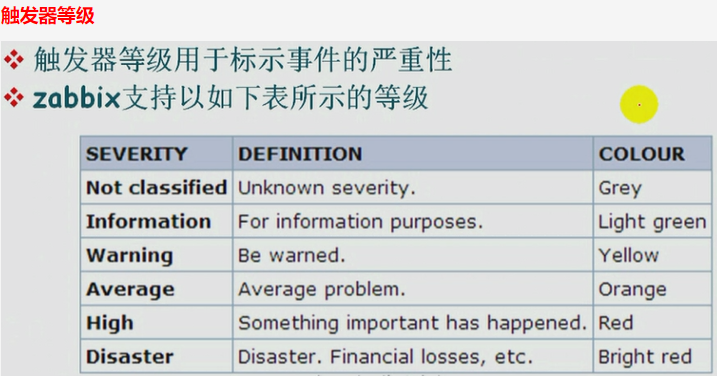
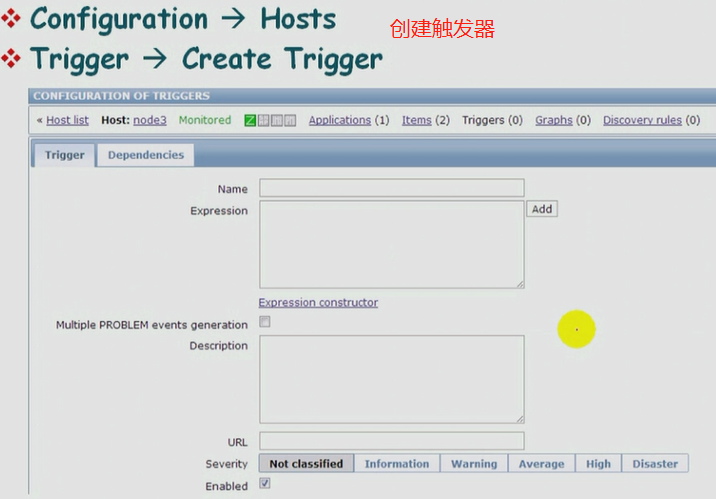
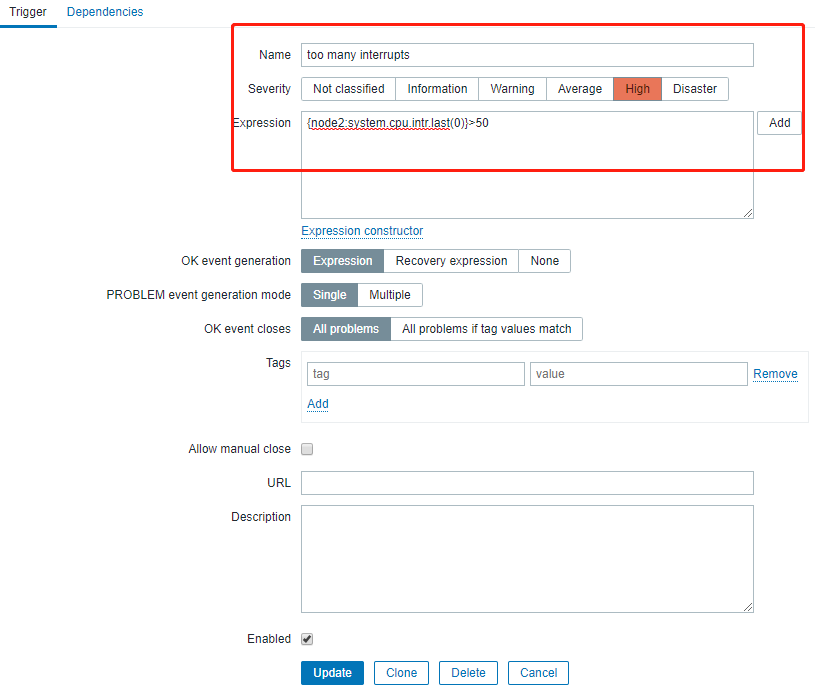
Trigger名称中可以使用宏:{HOST.HOST},{HOST.NAME},{HOST.CONN},{HOST.DNS}

现在利用hping3工具发包,使cpu中断数增加
# wget http://www.hping.org/hping3-20051105.tar.gz
或者
# wget https://github.com/antirez/hping/archive/master.zip
# unzip master.zip
# yum install -y gcc libpcap libpcap-devel tcl tcl-devel 参考 https://www.topjishu.com/11392.html
# ln -sf /usr/include/pcap-bpf.h /usr/include/net/bpf.h
# unzip hping-master.zip
# cd hping-master/
# ./configure
# make
# make install
# hping -h 可以查看使用方法
# hping3 192.168.128.132 --faster
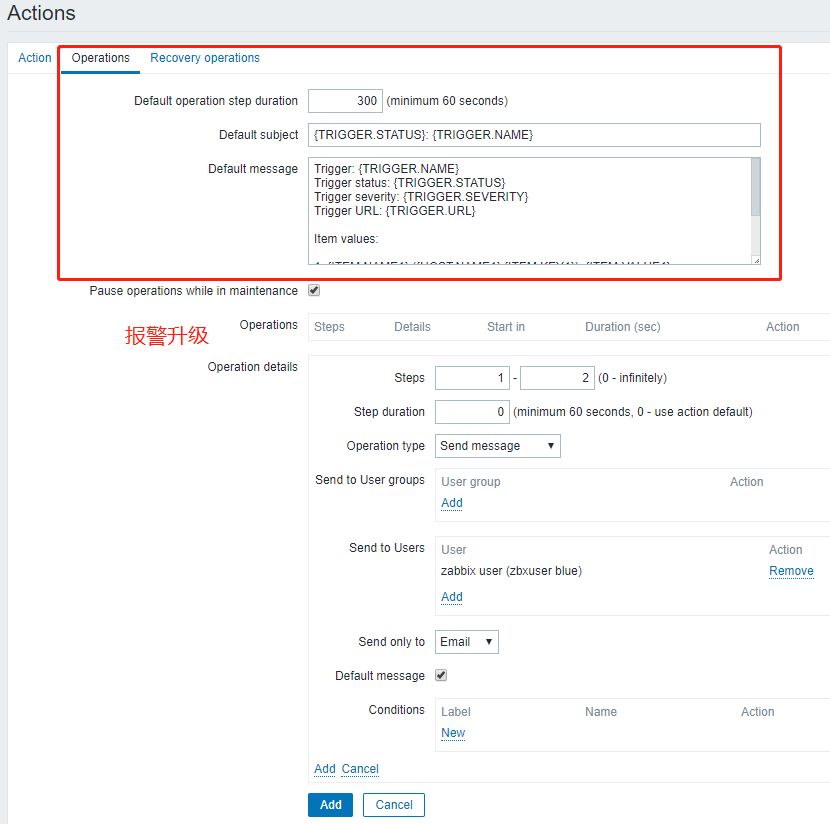
下面定义报警方式action https://blog.csdn.net/hao134838/article/details/57568332

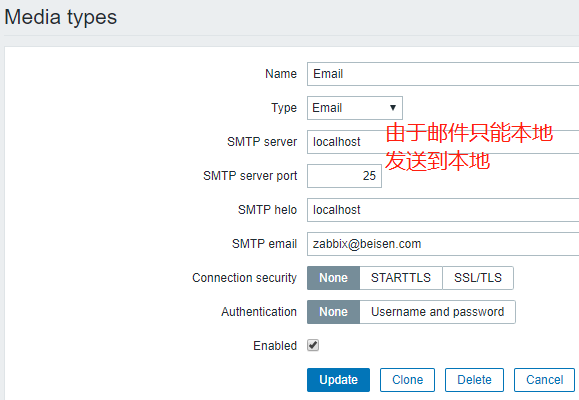
报警信息是发给zabbix用户的,这个用户要事先定义的
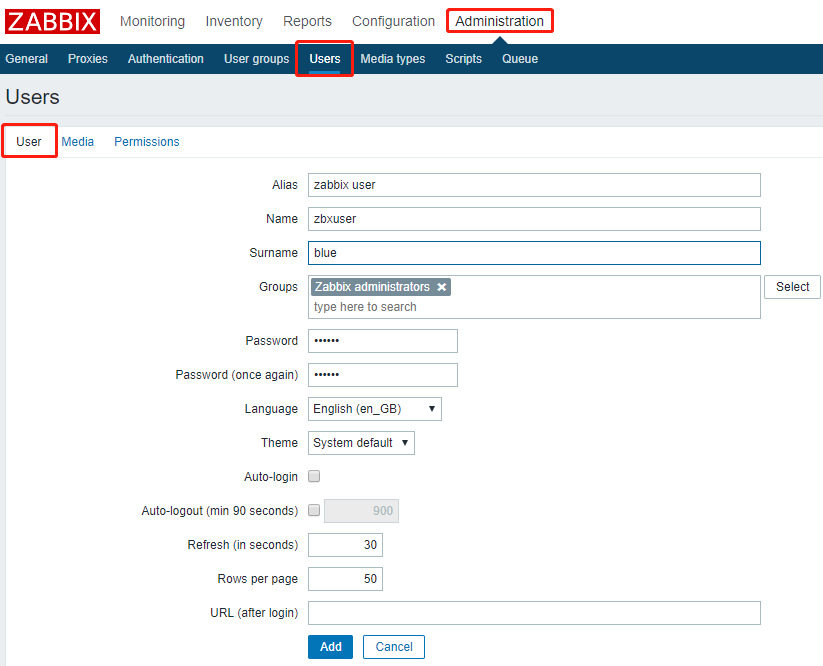
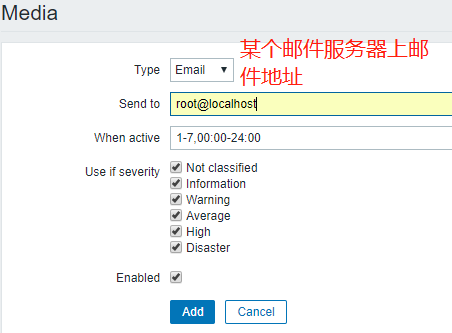
当zabbix执行报警时,会报警给zbxuser,zbxuser所关联的账号是root@localhost,所以root用户也会收到信息。
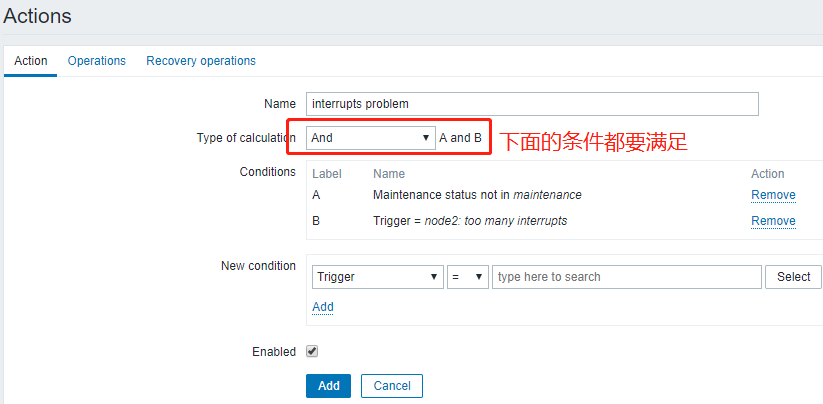
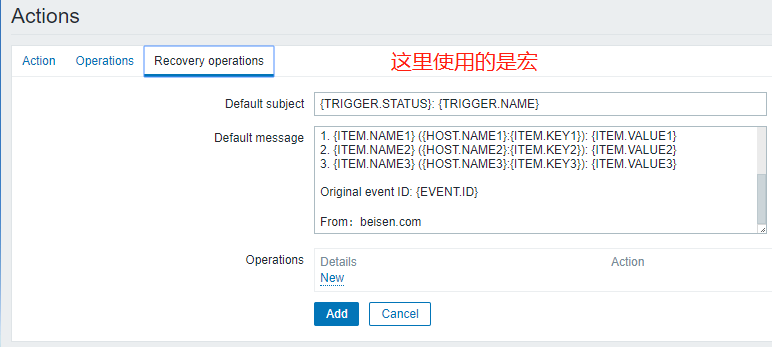
下面配置报警功能:
action有两类:
send message
command

# hping3 192.168.128.132 --faster //提高中断数
Taking Care of Zabbix
By now you should be ready to set up a Zabbix system that looks after your servers, applications, switches, various IP devices, and lots of other things. Zabbix will dutifully gather historic information about their well-being and inform responsible persons in case any problem is found. It will send e-mail messages, SMS messages in some more pressing situations, open tracker tickets, and maybe restart a service here or there. But who's going to take care of the poor, little Zabbix? Let's look at what can we do to make Zabbix running happily, and what measures we can use to prevent or solve problems:
-
Monitoring the internal health of your Zabbix system
-
What other things can we change to improve performance, including some MySQL specific advice and other methods
-
Finding and using Zabbix internal audit logs
-
Making sure that Zabbix keeps on running and data is not lost by creating backups and even more importantly, restoring from them
Internal items
While Zabbix can monitor nearly anything about external systems, it can be useful to actually know what it takes to do that, and how many things are covered. This is where internal items can help. We already briefly looked at some global data on our Zabbix server - where was that?
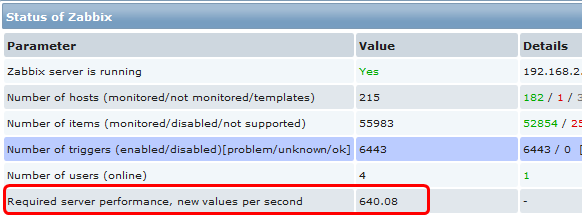
In the frontend, open Reports | Status of Zabbix. Here we can observe high-level information like whether the Zabbix server is running and values like the number of hosts, items, triggers, and users online. As we might remember, the value next to Required server performance, new values per second was important when determining how powerful hardware we would need.
This report is useful if we want to take a quick look to determine server condition, report on configuration for the management, or brag on IRC, but we can't see here any data like if the amount of new values per second has increased recently, and how that correlate's to the number of active items we have.
Let's try to see how we could store these values for feel-good graphs later, shall we? Navigate to Configuration | Hosts, click on Items for A Test Host, then click on Create Item button. In this form, start by clicking on Select next to the Key field, then change Type dropdown to Zabbix internal. This presents us with a nice list of available internal items. While the list provides short descriptions, it might be useful to know when each is useful.
-
zabbix[history]: Provides a list of values in the
historytable, this metric tells us how many values in total we have gathered for the numeric (float) data type. -
zabbix[history_str]: Lists the amount of values in the
history_strtable - the one containing data for character data type. Having access to all the history data can be useful in the long run to determine how particular data type has grown over time. -
zabbix[items]: Lists the number of items in the Zabbix database. We can see the same in Zabbix status report, only now we can create graphs showing how the item count has increased (or maybe decreased) during Zabbix's lifespan.
-
zabbix[items_unsupported]: Lists the number of unsupported items in the Zabbix database - the same list we can see in Zabbix status report. Not only might this be interesting to look at for historical purposes, it also could be useful to have a trigger on this value notably increasing - that would be an indicator of some serious problem.
-
zabbix[log]: As a counterpart to the log files, this item could be used as a source for triggers to notify on some specific condition the Zabbix server has encountered. Obviously, log file is going to contain better information regarding database problems, as this item would want to insert such information in the very same database.
-
zabbix[queue]: Shows the total number if items placed in the queue. A notable increase can mean either some problem on the Zabbix server itself, or some connectivity problem to the monitored devices.
-
zabbix[trends]: Lists the amount of values in the
trendstable. Long term data storage requirements for numeric metrics can be quite precisely determined, as the size of each record does not fluctuate much from the average. -
zabbix[triggers]: The total number of triggers configured. When compared with amount of items, this value can provide an insight into whether this installation is more geared towards historical data collection, or reaction on problems and notifying about those. If the relative amount of triggers compared with items is small, this installation is gathering more data than it is reacting on changes in that data and vice versa.
There are also some other internal items, not mentioned in this list:
-
zabbix[boottime]: The time when the Zabbix server was started. This value is stored in Unix time format, thus displaying this value as-is would be quite useless. For this key, it is suggested to use the
unixtimeunit, which will convert the timestamp into human-readable form. -
zabbix[uptime]: Shows how long the Zabbix server has been running. Again, this is stored in Unix time format, so for meaningful results the
uptimeunit should be used. -
zabbix[requiredperformance]: Visible in the Zabbix status report and the one indicative of performance requirements. As it is an important indicator, gathering historic information is highly desirable.
-
zabbix[rcache]: As Zabbix server caches monitored host and item information, that cache can take up lots of space in larger installation. This item allows you to monitor various parameters of this cache. It can be a good indicator as to when you would have to increase cache size. Consult the Zabbix manual for a list of the available modes for this item.
-
zabbix[wcache]: This item allows you to monitor how many values are processed by the Zabbix server, and how used the write cache is, which contains item data that is pooled to be written to the database. High cache usage can indicate database performance problems. Again, consult the Zabbix manual for available cache monitoring parameters.
Remember that we created an item to monitor the time when the proxy had last contacted server - that's another Zabbix internal item, although not mentioned in this list.
While with the boottime and uptime metrics there isn't much choice about how to store them, with other keys we could use different approaches depending on what we want to see.
For example, the zabbix[trends] value could be stored as is, thus resulting in a graph, showing the total amount of values. Alternatively, we could store it as delta, displaying the storage requirement change over time. Positive values would denote a need for increased storage, while negative values would mean that the amount of values we have to store is decreasing. There's no hard rule on which is more useful, so choose the method depending on which aspect interests you more.
Let's try to monitor some Zabbix internal item them. In the frontend, open Configuration | Hosts, then click on Items link next to A Test Host, then click Create Item. We are choosing this host because it is our Zabbix server and it makes sense to attach such items to it. Fill in these values:
-
Description: Enter Zabbix server uptime
-
Type: Select Zabbix internal
-
Key: Enter
zabbix[uptime] -
Units: Enter
uptime -
Update interval: Change to 120
-
Keep history: Change to 7
When you are done, click Save, then go to Monitoring | Latest data. Make sure A Test Host is selected in the Host dropdown, enter uptime in the filter field and click Filter. You should be left with a single item in the list, which shows in a human-readable format for how long Zabbix server process has been running.
This item could be used for problem investigation regarding the Zabbix server itself, or it could be placed in some screen by using Plain textresource and setting it to a show single line only.
While useful, this metric does not provide nice graphs in most cases, so let's add another item. Navigate to Configuration | Hosts, click on Itemsnext to A Test Host and click Create Item. Enter these values:
-
Description: Enter New values per second
-
Type: Select Zabbix internal
-
Key: Enter
zabbix[requiredperformance] -
Type of information: Select Numeric (float)
-
Update interval: Change to 120
-
Keep history: Change to 7
When you are done, click Save. Again, review the result in Monitoring | Latest data. In the filter field, enter values and click Filter. You will see an amount of new values per second, which will be almost the same as the one visible in Zabbix status report except that here it will be rounded to two decimal places, and in the report it will have precision of four. Our test server still doesn't have a large number of items to monitor.
Now let's do something radical. Go to Configuration | Hosts, make sure Linux servers is selected in the Group dropdown, and mark the checkboxes next to IPMI Host and Another Host, then choose Disable selected from the action dropdown at the bottom and click Go, then confirm the pop up. That surely has to impact new value per second count - to verify, open Monitoring | Latest data. Indeed, we now are receiving less data per second.
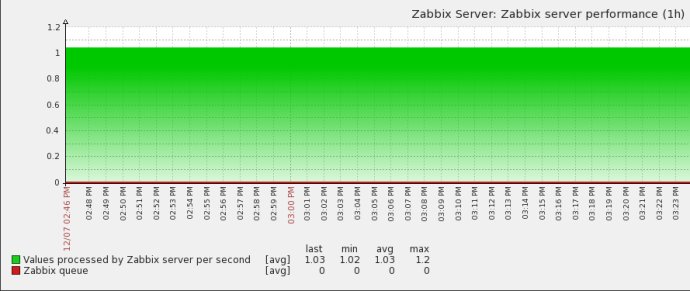
That should also be visible in the graph - click on Graph in the History column. Indeed, the drop is clearly visible.
Such graphs would be interesting to look at over a longer period, showing how a particular Zabbix instance has evolved. Additionally, a sharp increase might indicate misconfiguration and warrant attention - for example, a trigger expression that would catch if the new values per second increased by ten during last two minutes for the item we created could look like this:
{A Test Host:zabbix[requiredperformance].last(#1)}-{A Test Host:zabbix[requiredperformance].last(#2)}>10
As it could also indicate valid large proper configuration additions, you probably don't want to set severity of such trigger very high. With this item set up, let's switch those two hosts back on - go to Configuration | Hosts, mark checkboxes next to IPMI Host, and Another host, then choose Activate selected in the action dropdown and click Go.
Performance considerations
It is good to monitor Zabbix's well-being and what amount of data it is pulling in or receiving, but what do you do when performance requirements increase and the existing backend does not fully satisfy those anymore? The first thing should always be reviewing actual Zabbix configuration.
-
Amount of items monitored. Is everything that has an item created really useful? Is it ever used in graphs, triggers, or maybe manually reviewed? If not, consider disabling unneeded items. Network devices tend to be over-monitored at first by many users - there's rarely a need to monitor all 50 ports on all your switches with four or six items per port, updated every 10 seconds. Also review items that duplicate relevant information, like free disk space and free disk space percentage—most likely, you don't need both.
-
Item intervals. Often having a bigger impact than absolute item count, setting item intervals too low can easily bring down a Zabbix database. You probably don't have to the check serial number of a few hundred switches every minute, not even every day. Increase item intervals as much as possible in your environment.
Still, the amount of things to look after tends to grow and there's only that much to gain from tweaking items while still keeping them useful. At that point it is useful to know common performance bottlenecks. Actually, for Zabbix the main performance bottleneck is database write speed. This means that that we can attack the problem on two fronts - either reducing the amount of query writing, or increasing writing performance.
Reducing the query count
Reducing the query count to the database would improve the situation, and there are a couple of simple approaches we can use.
-
Method one: Use active items where possible. Remember, active agents gather a list of checks they have to perform and the Zabbix server does not have to keep track of when each check should be performed. This reduces the database load because just scheduling each check on the server requires multiple reads and at least one write to the database, and then the retrieved values have to be inserted into the database. Active item data is also buffered on the agent side, thus making data inserts happen in larger blocks. See Chapter 3 for reminder of how to set up active agents.
-
Method two: Use proxies. These we discussed in detail, and proxies have even greater potential to reduce Zabbix server load on the database. Zabbix proxies can check lots of things that Zabbix agents can't, including SNMP, IPMI, and websites, thus lots of work can be offloaded from the server. We discussed proxies in Chapter 12.
Increasing write performance
Another helpful area is tuning and configuring database to increase its performance. That is a mix of science and art, which we have no intention to delve deep into here, so we'll just mention some basic things one might look into more detail.
Method one: Tune database buffering. For MySQL with InnoDB engine there are some suggested basic parameters.
-
Buffer pool size: Parameter
innodb_buffer_pool_sizecontrols size of in-memory cache InnoDB uses. This is something you will want to set as high as possible without running out of memory. MySQL's documentation suggests around 80% of available memory on dedicated database servers, so on a server that is shared by the database, frontend, and server you might want to set it somewhat below this percentage. Additionally, if you don't have a swap configured, by setting this variable high you are increasing chances that all memory might become exhausted, so it is suggested to add some swap so that at least rarely accessed memory can be swapped out to accommodate database needs. -
Log file size: The parameter
innodb_log_file_sizecontrols the InnoDB log file size. Increasing log files reduces the frequency at which MySQL has to move data from logs to tables. It is suggested that you back up the database before performing this operation. Additionally, increasing this size must be performed offline by following simple steps:-
Stop the MySQL server
-
Move the log files somewhere else. They are named like
ib_logfile0,ib_logfile1and so on. -
As root, edit
/etc/my.cnfand increaseinnodb_log_file_size. There is no specific size you should choose, but setting it to at least 32M might be reasonable. -
Start the MySQL server.
-
Note that there's a caveat to this change - the bigger log files, the longer recovery takes after an unclean shutdown, such as a MySQL crash or hardware problems.
-
Temporary tables. A typical Zabbix database will require constant use of temporary tables, which are created and removed on the fly. These can be created in memory or on disk, and there are multiple configuration parameters depending on your MySQL version to control temporary table behavior, so consult the MySQL documentation for your version. Slow temporary tables will slow down the whole database considerably, so this can be crucial configuration. For example, attempting to keep the database files on an NFS volume will pretty much kill the database. In addition to MySQL parameters that allow tuning sizes when temporary tables are kept in memory or pushed to disk, there's also one more global parameter -
tmpdir. Setting this in/etc/my.cnfallows you to place temporary on-disk tables in arbitrary locations. In the case of NFS storage, local disks would be a better location. In the case of local storage, a faster disk like a flash-based one would be a better location. In all cases, setting the temporary directory to a tmpfs or ramdisk will be better than without. This approach also works around MySQL internals and simply pushes temporary tables into RAM.
tmpfs and ramdisk is that tmpfs can swap out less used pages, while ramdisk will keep all information in memory.Method two: Splitting the data. There are different methods that would allow you to split data over physical devices where parallel access to them is faster.
-
Separating tables themselves. By default, InnoDB storage places all tablespace data in large, common files. Setting the MySQL option
innodb_file_per_tablemakes it store each table in a separate file. The major gain from this is the ability to place individual tables on separate physical media. Common targets for splitting out in a Zabbix database are the tables that are used most often -history,history_str,history_uint, anditems. Additionally,functions,items,trends, andtriggerstables also could be separated. -
Using built-in database functionality like partitioning. This is a very specific database configuration topic which should be consulted upon database documentation.
-
Using separate servers for Zabbix components. While small Zabbix installations easily get away with a single machine hosting server, database, and frontend, that becomes infeasible for large ones. Using a separate host for each component allows you to tailor configuration on each for that specific task.
Method three: Increasing hardware performance. This is the most blunt approach, and also requires financial investment, this can make quite some difference. Key points when considering Zabbix hardware:
-
Lots of RAM. The more the better. Maybe you can even afford to keep the whole database in RAM with caching.
-
Fast I/O subsystem. As mentioned, disk throughput is the most common bottleneck. Common strategies to increase throughput include using faster disks, using battery backed disk controllers, and using appropriate disk configurations. What would be appropriate for Zabbix? RAID 10 from as many disks as possible would be preferred because of the increased read, and most importantly write performance and decent availability.
These are just pointers on how one could improve performance. For any serious installation both the hardware and the database should be carefully tuned according to the specific dataflow.
Who did that?
«Now who did that?» - a question occasionally heard in many places, IT workplaces included. Weird configuration changes, unsolicited reboots. Accountability and trace of actions help a lot to determine that the questioner was the one who made the change and then forgot about it. For Zabbix configuration changes, an internal audit log is available. Just like most functionality, it is conveniently accessible from the web frontend. During our configuration quest we have made quite a lot of changes - let's see what footprints we left. Navigate to Administration | Audit, set the filter field Actions since to be about week ago, and click Filter. We are presented with a list of things we did. Every single one of them. In the output table we can see ourselves logging in and out, and adding and removing elements, and more.
But pay close attention to the filter. While we can see all actions in a consecutive fashion, we can also filter for a specific user, action, or resource.
How fine-grained are those action and resource filters? Expand each and examine the contents. We can see that the action list has actions both for logging in and out, as well as all possible element actions like adding or updating.
The resource filter has more entries. The dropdown can't even show them all simultaneously - we can choose from nearly anything you could imagine while working with Zabbix frontend, starting with hosts and items, and ending with value maps and scripts.
Exercise: Find out at what time you added the Restart Apache action.
While in this section, let's remind ourselves of another logging area - the action log that we briefly looked at before. In the upper-right dropdown, choose Actions. Here, all actions performed by the Zabbix server are recorded. This includes sending e-mails, executing remote actions, sending SMS messages, and executing custom scripts. This view provides information on what content was sent to whom, whether it was successful, and any error messages, if it wasn't. It is useful for verifying whether Zabbix has or has not sent a particular message, as well as figuring out whether the configured actions are working as expected.
Together, the action and log audit sections provide a good overview of internal Zabbix configuration changes as well as debugging help to determine what actions have been performed.
Real men make no backups
And use RAID 0, right? Still, most do make backups, and for a good reason. It is a lucky person who creates backups daily and never needs one, and it is a very unfortunate person who needs a backup when one has not been created, so we will look at the basic requirements for backing up Zabbix.
Backing up the database
As almost everything Zabbix needs is stored in the database, it is the most crucial part to take care of. While there are several ways to create a MySQL database backup, including file level copying (preferably from an LVM snapshot) and using database replication, most widely used method is creation of database dump using native MySQL utility, mysqldump. Using this approach provides several benefits:
-
It is trivial to set up
-
The resulting backup is more likely to work in a different MySQL version (file system level file copying is not as portable as the SQL statements, created by
mysqldump) -
It can usually create a backup without disturbing the MySQL server itself
Drawbacks of this method include:
-
Heavily loaded servers might take too long to create backup
-
It usually requires additional space to create data file in
While it is possible with several backup solutions to create backup from mysqldump output directly, without the intermediate file (for example, backup solution Bacula (http://www.bacula.org) has support for FIFO, which allows to backup dump stream directly; consult Bacula documentation for more information), it can be tricky to set up and tricky to restore, thus usually creating an intermediate file isn't such a huge drawback, especially as they can be compressed quite well.
To manually create a full backup of the Zabbix database, you could run:
$ mysqldump -u zabbix -p zabbix > zabbix_database_backup.db
This would create SQL statements to recreate the database in a file named zabbix_database_backup.db. This would also be quite ineffective and possibly risky, so let's improve the process. First, there are several suggested flags for mysqldump:
-
–add-drop-table: Will add table dropping statements so we won't have to remove tables manually when restoring. -
–add-locks: Will result in faster insert operations when restoring from the backup. -
–extended-insert: This will use multi-row insert statements and result in a smaller data file, as well as a faster restore process. -
–single-transaction: Uses a single transaction for the whole backup creation process, thus a backup can have a consistent state without locking any tables and delaying the Zabbix server or frontend's processes. As Zabbix uses transactions for database access as well, the backup should always be in a consistent state. -
–quick: This option makesmysqldumpretrieve one row at a time, instead of buffering all of them, thus it speeds up backups of large tables. As Zabbix history tables usually have lots of records in them, this is a suggested flag for Zabbix database backups.
Then, it is suggested to compress the dump file. As it is a plaintext file containing SQL statements, it will have a high compression ratio, which not only requires less disk space, but often actually improves performance - often it is faster to write less data to the disk subsystem by compressing it and then writing smaller amount of data. So the improved command could look like:
$ mysqldump zabbix -–add-drop-table -–add-locks –-extended-insert –single-transaction –quick -u zabbix -p | bzip2 > zabbix_database_backup.db.bz2
Here we used bzip2 to compress the data before writing it to the disk. You can choose other compression software like gzip or xz, or change compression level, depending on what you need more - disk space savings or a less-taxed CPU during the backup. The great thing is, you can run this backup process without stopping the MySQL server (actually, it has to run) and even Zabbix server. They both continue running just like before, and you get a backup of the database as it looked like at the moment when you started the backup.
Now you can let your usual backup software grab this created file and store it on a disk array, tape or some other, more exotic media.
There are also other things you might consider for backing up - Zabbix server, agent and proxy configuration files, web frontend configuration file, and any modifications you might have made to the frontend definitions file, includes/defines.inc.php.
utility—mk-parallel-dump from Maatkit project (http://www.maatkit.org). It will dump database tables in parallel, quite likely resulting in a faster backup. Note that for a parallel restore you would have to use the companion utility, mk-parallel-restore.Restoring from backup
Restoring such a backup is trivial as well. We pass the saved statements to the MySQL client, uncompressing them first, if necessary:
$ bzcat zabbix_database_backup.db.bz2 | mysql zabbix -u zabbix -p
zcat or xzcat as appropriate if you have chosen a different compression utility.Of course, backups are useful only if it is possible to restore them. As required by any backup policy, the ability to restore from backups should be tested. This includes restoring the database dump, but it is also suggested to compare the schema of the restored database and the actual one, as well as running a copy of Zabbix server on a test system. Make sure to disallow any network connections by the test server, though, otherwise it might overload the network or send false alerts.
Separating configuration and data backups
While we can dump whole database in a single file, it is not always the best solution - sometimes you might have somehow messed up the configuration beyond repair. With the data left intact, it would be nice to restore configuration tables only, as that would be much faster. To prepare for such situations, we can split tables in two groups - those required for Zabbix configuration and those not required, or configuration and data tables.
We can consider the list of the following tables as data tables, and all other tables - configuration tables.
-
alerts
-
auditlog
-
events
-
history
-
history_log
-
history_str
-
history_str_sync
-
history_sync
-
history_text
-
history_uint
-
history_uint_sync
-
node_cksum
-
proxy_dhistory
-
proxy_history
-
service_alarms
-
services_times
-
trends
-
trends_uint
Now we can update our backup command to include a specific set of tables only:
$ mysql zabbix –add-drop-table –add-locks –extended-insert –single-transaction –quick -u zabbix -p –tables alerts auditlog events history history_log history_str history_str_sync history_sync history_text history_uint history_uint_sync node_cksum proxy_dhistory proxy_history service_alarms services_times trends trends_uint | bzip2 > zabbix_data_backup.db.bz2
This way we are creating a separate backup of data tables in a file named zabbix_data_backup.db.bz2.
Exercise - determine the list of other configuration tables.
Summary
After Zabbix is installed and configured, a moment comes when maintenance tasks become important. In this last chapter we looked at three important tasks:
-
Tuning for performance
-
Reviewing Zabbix built-in auditing capabilities
-
Creating backups
The database performance bottleneck is the one most often reached, and as we found out, we could attack this problem from different angles. We could reduce the write load, distribute it, or increase database performance itself using both software level tuning and hardware improvements.
If you notice a sudden change in Zabbix server behavior like load increase, it can be very helpful to find out what configuration changes have been performed just prior to that. And if there are multiple Zabbix administrators, it is even better, as you can find out who exactly performed a specific change. This is where the built-in auditing capabilities of Zabbix help a lot by providing a change list and also exact change details for many operations.
And reaching one of the most joyful events, a successful backup restore in a case of emergency data loss, we left for the end, where we looked at basic suggestions for Zabbix database backup copy creation and restoration, considering Zabbix's availability during the backup, as well as restore performance.
Of course, both performance and backup suggestions in this chapter are just starting steps, with a goal to help new users. As your database grows and gains specific traits, you will have to apply different methods, but it will be helpful if the design and layout you use from the start will have future scalability and availability taken into account.
#####sample 优化方法3
zabbix优化指南
1.如何度量Zabbix性能
通过Zabbix的NVPS(每秒处理数值数)来衡量其性能。
在Zabbix的dashboard上有一个错略的估值。
在4核CPU,6GB内存,RAID10(带有写入缓存)这样的配置条件下,Zabbix可以处理每分钟1M个数值,大约每秒15000个。
2.性能低下的可见症兆
zabbix队列中有太多被延迟的item: Administration -> Queue
zabbix绘图中经常性出现断档,一些item没有数据
带有nodata()函数的触发器出现false
前端页面无响应
3.哪些因素造成Zabbix性能低下
| 因素 | 慢 | 块 |
| 数据库大小 | 巨大 | 适应内存大小 |
| 触发器表达式的复杂程度 | Min(),max(),avg() | Last(),nodata() |
| 数据收集方法 | 轮讯(SNMP,无代理,Passive代理) | Trapping(active代理) |
| 数据类型 | 文本,字符串 | 数值 |
| 前端用户数量 | 多 | 少 |
主机数量也是影响性能的主要因素
4.了解Zabbix工作状态
获得zabbix内部状态
zabbix[wcache,values,all]
zabbix[queue,1m] ----延迟超过1分钟的item
获得zabbix内部组件工作状态(该组件处于BUSY状态的时间百分比)
zabbix[process,type,mode,state]
其中可用的参数为:
type: trapper,discoverer,escalator,alerter,etc
mode: avg,count,min,max
state: busy,idel
5.Zabbix调优大的原则性建议
确保zabbix内部组件性能处于被监控状态(调优的基础!)
使用硬件性能足够好的服务器
不同角色分开,使用各自独立的服务器
使用分布式部署
调整MySQL性能
调整Zabbix自身配置
6.Zabbix数据库调优
a.使用专用数据服务器,配置应该较高,如能使用SSD最佳
给一个参考配置,可以处理NVPS为3000
Dell PowerEdge R610
CPU: Intel Xeon L5520 2.27GHz (16 cores)
Memory: 24GB RAM
Disks: 6x SAS 10k 配置 RAID10
b.每个table一个文件,修改my.cnf
c.使用percona代替mysql
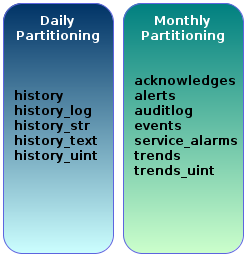
d.使用分区表,关闭Houerkeeper
关闭Houserkeeper,zabbix_server.conf
DisableHousekeeper=1
step 1.准备相关表
ALTER TABLE `acknowledges` DROP PRIMARY KEY, ADD KEY `acknowledgedid` (`acknowledgeid`);
ALTER TABLE `alerts` DROP PRIMARY KEY, ADD KEY `alertid` (`alertid`);
ALTER TABLE `auditlog` DROP PRIMARY KEY, ADD KEY `auditid` (`auditid`);
ALTER TABLE `events` DROP PRIMARY KEY, ADD KEY `eventid` (`eventid`);
ALTER TABLE `service_alarms` DROP PRIMARY KEY, ADD KEY `servicealarmid` (`servicealarmid`);
ALTER TABLE `history_log` DROP PRIMARY KEY, ADD PRIMARY KEY (`itemid`,`id`,`clock`);
ALTER TABLE `history_log` DROP KEY `history_log_2`;
ALTER TABLE `history_text` DROP PRIMARY KEY, ADD PRIMARY KEY (`itemid`,`id`,`clock`);
ALTER TABLE `history_text` DROP KEY `history_text_2`;
step2.设置每月的分区
以下步骤请在第一步的所有表中重复,下例是为events表创建2011-5到2011-12之间的月度分区。
ALTER TABLE `events` PARTITION BY RANGE( clock ) (
PARTITION p201105 VALUES LESS THAN (UNIX_TIMESTAMP("2011-06-01 00:00:00")),
PARTITION p201106 VALUES LESS THAN (UNIX_TIMESTAMP("2011-07-01 00:00:00")),
PARTITION p201107 VALUES LESS THAN (UNIX_TIMESTAMP("2011-08-01 00:00:00")),
PARTITION p201108 VALUES LESS THAN (UNIX_TIMESTAMP("2011-09-01 00:00:00")),
PARTITION p201109 VALUES LESS THAN (UNIX_TIMESTAMP("2011-10-01 00:00:00")),
PARTITION p201110 VALUES LESS THAN (UNIX_TIMESTAMP("2011-11-01 00:00:00")),
PARTITION p201111 VALUES LESS THAN (UNIX_TIMESTAMP("2011-12-01 00:00:00")),
PARTITION p201112 VALUES LESS THAN (UNIX_TIMESTAMP("2012-01-01 00:00:00"))
);
step3.设置每日的分区
以下步骤请在第一步的所有表中重复,下例是为history_uint表创建5.15到5.22之间的每日分区。
ALTER TABLE `history_uint` PARTITION BY RANGE( clock ) (
PARTITION p20110515 VALUES LESS THAN (UNIX_TIMESTAMP("2011-05-16 00:00:00")),
PARTITION p20110516 VALUES LESS THAN (UNIX_TIMESTAMP("2011-05-17 00:00:00")),
PARTITION p20110517 VALUES LESS THAN (UNIX_TIMESTAMP("2011-05-18 00:00:00")),
PARTITION p20110518 VALUES LESS THAN (UNIX_TIMESTAMP("2011-05-19 00:00:00")),
PARTITION p20110519 VALUES LESS THAN (UNIX_TIMESTAMP("2011-05-20 00:00:00")),
PARTITION p20110520 VALUES LESS THAN (UNIX_TIMESTAMP("2011-05-21 00:00:00")),
PARTITION p20110521 VALUES LESS THAN (UNIX_TIMESTAMP("2011-05-22 00:00:00")),
PARTITION p20110522 VALUES LESS THAN (UNIX_TIMESTAMP("2011-05-23 00:00:00"))
);
手动维护分区:
增加新分区
ALTER TABLE `history_uint` ADD PARTITION (
PARTITION p20110523 VALUES LESS THAN (UNIX_TIMESTAMP("2011-05-24 00:00:00"))
);
删除分区(使用Housekeepeing)
ALTER TABLE `history_uint` DROP PARTITION p20110515;
step4.自动每日分区
确认已经在step3的时候为history表正确创建了分区。
以下脚本自动drop和创建每日分区,默认只保留最近3天,如果你需要更多天的,请修改
@mindays 这个变量。
不要忘记将这条命令加入到你的cron中!
mysql -B -h localhost -u zabbix -pPASSWORD zabbix -e "CALL create_zabbix_partitions();"
自动创建分区的脚本:
https://github.com/xsbr/zabbixzone/blob/master/zabbix-mysql-autopartitioning.sql
e.使用tmpfs存储临时文件
mkdir /tmp/mysqltmp
修改/etc/fstab:
tmpfs /tmp/mysqltmp tmpfs
rw,uid=mysql,gid=mysql,size=1G,nr_inodes=10k,mode=0700 00
修改my.cnf
tmpdir=/tmp/mysqltmp
f.设置正确的buffer pool
设置innode可用多少内存,建议设置成物理内存的70%~80%
修改my.cnf
innode_buffer_pool_size=14G
设置innodb使用O_DIRECT,这样buffer_pool中的数据就不会与系统缓存中的重复。
innodb_flush_method=O_DIRECT
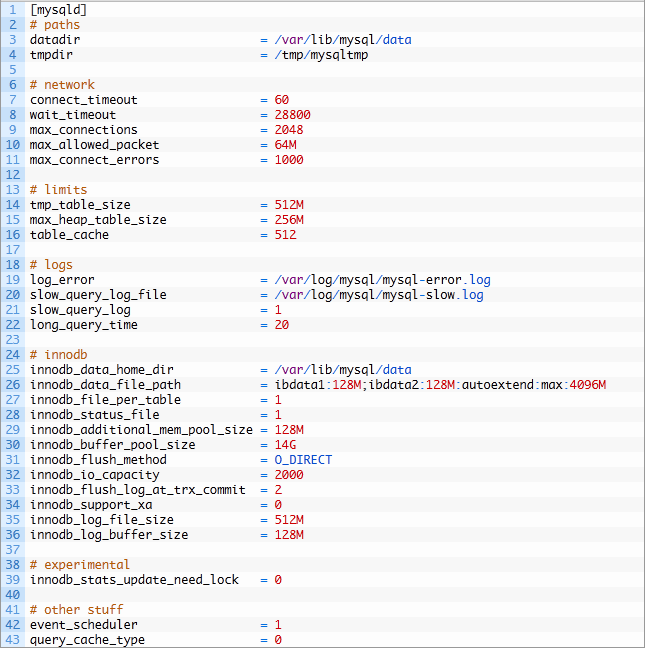
下面是my.cnf,物理内存大小为24G.
g.设置合适的log大小
Zabbix数据库属于写入较多的数据库,因此设置大一点可以避免Mysql持续将log文件flush表中。
不过有一个副作用,就是启动和关闭数据库会变慢
修改my.cnf
innodb_log_file_size=64M
h.打开慢查询日志
修改my.cnf
log_slow_queries=/var/log/mysql.slow.log
i.设置thread_cache_size
这个值似乎会影响show global status输出中Threads_created per Connection的hit rate
当设置成4的时候,有3228483 Connections和5840 Threads_created,hit rate达到了99.2%
Threads_created这个数值应该越小越好
j.其他Mysql文档建议的参数调整
query_cache_limit=1M
query_cache_size=128M
tmp_table_size=256M
max_heap_table_size=256M
table_cache=256
max_connections=300
innodb_flush_log_at_trx_commit=2
join_buffer_size=256k
read_buffer_size=256k
read_rnd_buffer_size=256k
7.调整zabbix工作进程数量,zabbix_server.conf
StartPollers=90
StartPingers=10
StartPollersUnreacheable=80
StartIPMIPollers=10
StartTrappers=20
StartDBSyncers=8
LogSlowQueries=1000
参考文档:
http://www.slideshare.net/xsbr/alexei-vladishev-zabbixperformancetuning
http://zabbixzone.com/zabbix/mysql-performance-tips-for-zabbix/
http://zabbixzone.com/zabbix/partitioning-tables/
http://linux-knowledgebase.com/en/Tip_of_the_day/March/Performance_Tuning_for_Zabbix
http://sysadminnotebook.blogspot.jp/2011/08/performance-tuning-mysql-for-zabbix.html
https://www.zabbix.com/documentation/2.4/manual/installation/install_from_packages#red_hat_enterprise_linux_centos
https://www.zabbix.com/documentation/2.4/manual/appendix/install/db_scripts
http://www.percona.com/blog/2014/11/14/optimizing-mysql-zabbix/
http://blog.csdn.net/crazyhacking/article/details/20549577
http://www.slideshare.net/xsbr/alexei-vladishev-zabbixperformancetuning
lc-messages-dir=/usr/share/mysql/english
explicit_defaults_for_timestamp
tcc_login_restrict_mode=0 #OneSQL only
tcc_async_commit_mode=on #OneSQL only
innodb_use_native_aio=ON
innodb_buffer_pool_size=14G #real_mem*0.75
innodb_buffer_pool_instances=8
innodb_log_file_size=128M
innodb_flush_method=O_DIRECT
innodb_flush_log_at_trx_commit = 0
slow-query-log=1
slow-query-log-file=slow.log
query_cache_size=0
query_cache_type=0
#innodb_file_per_table=1 #default setting in 5.6
#innodb_old_blocks_time = 1000 #default setting in 5.6
#sync_binlog=0 #default setting
#tmpdir=/dev/shm #use /dev/shm will disable AIO in 5.5 above
原文来自:http://blog.sina.com.cn/s/blog_704836f40101g0fb.html
#################翻译 sample2
监视Zabbix的健康状况以及它接收或接收的数据量是很好的,但是当性能需求增加并且现有的后端不再完全满足这些需求时,您会怎么做?
首先应该检查实际的zabbix配置。
监控的项目数量。所有创建了项目的东西真的有用吗?它是否曾用于图表、触发器,或者手动查看过?
如果没有,考虑禁用不需要的项目。网络设备一开始往往被许多用户过度监控——很少需要用每个端口4到6个项目来监控所有交换机上的50个端口,
每10秒更新一次。还可以查看重复相关信息的项目,例如最有可能的可用磁盘空间和可用磁盘空间百分比,这两者都不需要。
项目间隔。通常会比绝对项目计数产生更大的影响,将项目间隔设置得太低很容易导致zabbix数据库崩溃。
你可能不必每分钟检查几百个开关的序列号,甚至不必每天检查。在您的环境中尽可能增加项目间隔。
不过,要照顾的东西的数量往往会增加,在保持有用的同时,调整物品只会获得那么多。此时,了解常见的性能瓶颈非常有用。
实际上,对于Zabbix,主要的性能瓶颈是数据库写入速度。这意味着我们可以从两个方面来解决这个问题——要么减少查询写入的数量,要么提高写入性能。
减少查询计数
减少对数据库的查询计数可以改善这种情况,我们可以使用一些简单的方法。
尽可能使用物品。
记住,活动代理收集他们必须执行的检查列表,Zabbix服务器不必跟踪何时执行检查。这减少了数据库负载,
因为只需在服务器上安排每次检查就需要对数据库进行读操作和至少一次写操作,然后将检索到的值插入到数据库中。
活动项数据也在代理端进行缓冲,从而使数据插入发生在更大的块中。有关如何设置活动代理的提示,请参阅第3章。
方法二:使用代理。我们详细讨论了这些问题,并且代理有更大的潜力来减少数据库上的zabbix服务器。zabbix代理可以检查zabbix代理不能检查的许多内容,
包括snmp、ipmi和网站,因此可以从服务器加载大量工作。我们在第12章讨论了代理。
另一个有用的领域是调整和配置数据库以提高其性能。这是科学和艺术的结合,我们无意深入研究,所以我们只会提到一些基本的事情,我们可能会更详细地研究。
方法一:优化数据库缓冲。对于使用InnoDB引擎的MySQL,有一些建议的基本参数。
缓冲池大小:参数innodb_buffer_pool_size控制innodb使用的内存缓存的大小。这是您希望在不耗尽内存的情况下设置为尽可能高的值。
MySQL的文档建议在专用数据库服务器上使用大约80%的可用内存,因此在由数据库、前端和服务器共享的服务器上,您可能希望将其设置为略低于此百分比。此
外,如果您没有配置交换,那么通过将此变量设置为高,可以增加所有内存耗尽的可能性,因此建议添加一些交换,以便至少很少访问的内存可以交换出来以
满足数据库的需要。
日志文件大小:参数innodb_log_file_size控制innodb日志文件大小。增加日志文件会降低MySQL将数据从日志移动到表的频率。
建议您在执行此操作之前备份数据库。此外,增加此大小必须通过以下简单步骤离线执行:
停止MySQL服务器
将日志文件移到其他位置。
它们的名称类似于ib_logfile0、ib_logfile1等等。
作为根目录,编辑/etc/my.cnf并增加innodb_log_文件的大小。
没有您应该选择的具体尺寸,但将其设置为至少32m可能是合理的。
启动MySQL服务器。
请注意,这个更改有一个警告——日志文件越大,在不干净的关机后恢复时间越长,例如MySQL崩溃或硬件问题。
临时表。典型的zabbix数据库需要经常使用临时表,这些临时表是动态创建和删除的。这些可以在内存或磁盘上创建,
根据您的MySQL版本有多个配置参数来控制临时表行为,因此请参考MySQL文档了解您的版本。缓慢的临时表会大大降低整个数据库的速度,
因此这可能是关键配置。例如,试图将数据库文件保存在一个NFS卷上,将几乎杀死数据库。
除了mysql参数允许在将临时表保存在内存中或推送到磁盘上时调整大小外,还有一个全局参数tmpdir。在/etc/my.cnf中设置此项允许您将
临时磁盘表放置在任意位置。对于NFS存储,本地磁盘将是更好的位置。在本地存储的情况下,像基于闪存的更快的磁盘将是更好的位置。
在所有情况下,将临时目录设置为tmpfs或ramdisk都比不设置要好。这种方法也适用于MySQL内部,只需将临时表推送到RAM中即可。
tmpfs和ramdisk的一个主要区别是tmpfs可以交换使用较少的页面,而ramdisk将把所有信息保存在内存中。
方法二:拆分数据。有不同的方法可以让您在物理设备上拆分数据,在物理设备上并行访问数据更快。
分开桌子本身。默认情况下,InnoDB存储将所有表空间数据放在大型通用文件中。通过设置mysql选项innodb_file_per_table,它可以将每个表存储在单独的文件中。
从中获得的主要好处是能够将单个表放置在单独的物理媒体上。
在zabbix数据库中拆分的常见目标是最常用的表-历史记录、历史记录、历史记录和项目。
->此外,还可以分离函数、项、趋势和触发器表。
使用诸如分区之类的内置数据库功能。这是一个非常具体的数据库配置主题,应该参考数据库文档。
->为zabbix组件使用单独的服务器。虽然小型的Zabbix安装很容易通过一台主机来承载服务器、数据库和前端,但对于大型的Zabbix安装来说,这是不可行的。
为每个组件使用单独的主机允许您为特定的任务定制每个组件的配置。
练习:了解您何时添加了restart-apache操作。
在第一个zabbix 1.8版本中,有些操作没有在审计日志中注册。这些问题有望在不久的将来得到解决。
在本节中,让我们提醒自己另一个日志记录区域——我们之前简要介绍过的操作日志。在右上角下拉列表中,选择“操作”。在这里,记录Zabbix服务
器执行的所有操作。这包括发送电子邮件、执行远程操作、发送短信和执行自定义脚本。此视图提供有关发送给谁的内容、是否成功以及是否发送了任
何错误消息的信息。它有助于验证Zabbix是否发送了特定消息,以及确定配置的操作是否按预期工作。
操作和日志审计部分一起提供了内部zabbix配置
更改的良好概述,以及调试帮助确定已执行的操作。
############sample 6
https://www.xiaomastack.com/2014/10/10/zabbix02/
运维监控篇(2)_Zabbix简单的性能调优
Zabbix是一款高性能的分布式监控报警系统。比如现在常见的家用台式机配置处理器I5-3470、内存4GB1600MHz、硬盘7200rpm就能够监控1000台左右的HOST,是的没错Zabbix就是可以达到这样的高性能。
Zabbix运行时间长了会出现小小的瓶颈,小小瓶颈中最大的瓶颈是数据库。怎样解决瓶颈,提供一些可能的方法。
首先在zabbix-server上也装上zabbix-agent,并启用Template App Zabbix Server模板,监控zabbix-server服务内部的各项参数。
启用模板后会新增加相应的监控项item、图形graph、触发器trigger。
类似这样的监控项会增加不少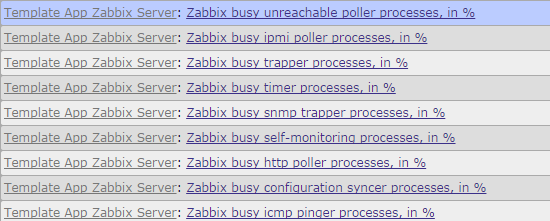
新增加的图形
类似这样的触发器也会增加很多
然后当Zabbix Server出现性能瓶颈的时候就会发出报警,根据触发器的报警项,来更改zabbix-server的配置参数来适应当前工作环境环境。
下面分析可能出现的情景
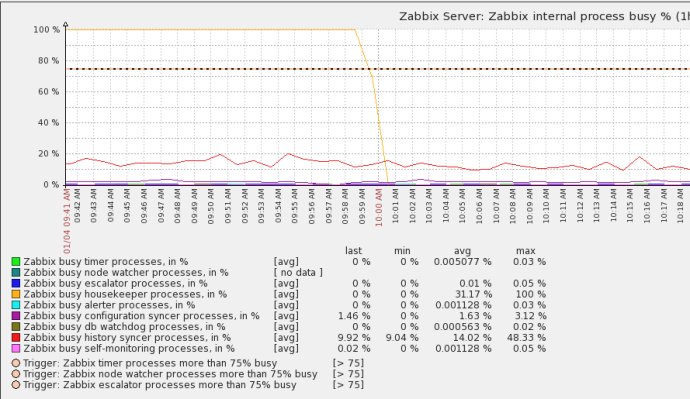
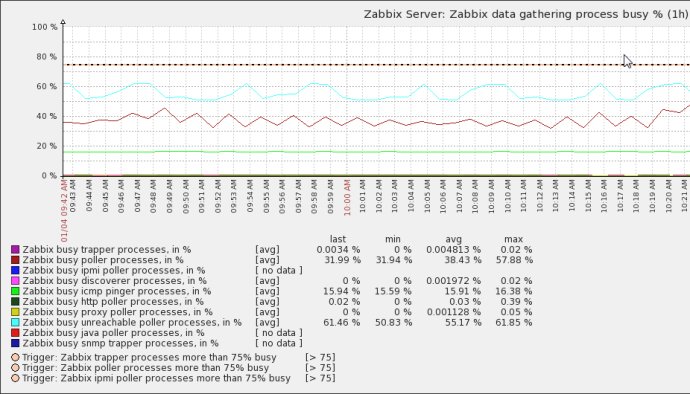
1、关于Zabbix data gathering process busy问题(server收集数据时zabbix-server各个进程的性能监控)
监控项如下:
比如discoverer监控项报警“Zabbix discoverer processes 75% busy”其实这时候查看这项的监控图或监控值可能达到了100%。
解决方法
编辑配置文件/usr/local/zabbix/etc/zabbix-server.conf,将StartDiscoverers参数增大,默认为1,将该参数增大到合适的数值,比如5.然后重启zabbix-server就好了,如果开启discoverer服务进程的利用率还继续飙高则继续增大discoverer启动进程数。
1
|
$ vim /usr/local/zabbix/etc/zabbix-server.conf
|
比如ipmi pinger监控项报警“Zabbix icmp pinger processes more than 75% busy”,同样更改server的配置文件,增大参数StartPingers,由默认的1改为合适的数值,比如5。然后重启zabbix-server就好了。
1
|
$ vim /usr/local/zabbix/etc/zabbix-server.conf
|
这个进程负载监控图各个监控项对应配置文件的参数和默认值如下,当某个进程负载过高时调整相应的值:
1
|
Zabbix busy trapper processes, in % StartTrappers=5
|
2、关于Zabbix cache usage问题(server各种缓存数据空闲值的监控)
监控项如下
这个缓存监控图各个监控项对应配置文件的参数和默认值如下,当某项buffer不够时增大容量到合适的值:
1
|
Zabbix-server: Zabbix trend write cache, % free TrendCacheSize=4M
|
3、监控项Item得设置合适的数据采样间隔interval,一般不要小于1分钟,对于长时间不变的量如内存总大小、磁盘总大小等应该尽量间隔时间大点比如一天(1d)或一周(1w)。
4、实在Host太多,还能怎样只能拆分架构,采用分布式架构减轻zabbix server 的压力,将这些压力分担到proxy上去。
5、历史数据是数据库爆满的主要原因。减少历史数据的保存时间,默认是90天,可以调成7天或更少,放心zabbix还保存着趋势数据,宏观上历史数据不会丢。
6、对history类型的(history、history_uint等)大表进行拆分操作,关闭housekeeper禁止自动定期清除历史记录数据,因为对于数据库特别是对于InnoDB引擎大数据删除貌似很蛋疼。




 浙公网安备 33010602011771号