利用遗传算法求解函数极小值
思想
遗传算法的根本思想就是达尔文的适者生存法则。
使用二进制编码(也就是基因),对要进行优化的问题的某个属性进行编码。对于更适应环境的个体它有更大的概率(选择)能够将自己的基因遗传给下一代(交叉)。
同时遗传算法还允许个体的基因有一定的概率发生突变(突变),这样可以丰富基因库,使得可以跳出局部最优,找到全局最优。
步骤
以找二元函数\(f(x,y)\)最大值为例。
- 确定群体数量n,并随机生成n个个体,对于每个个体都有两个长度为m的二进制串代表他们的DNA链,分别代表x、y.
- 确定适应度函数,在这个问题中适应度函数就是\(f(x,y)\),函数值越大代表其适应度越高.
- 将每个个体的基因序列转化为十进制值(二进制转十进制),并按照比例映射到规定的x,y区间中,用适应度函数计算每个个体的适应度.
- 选择:通过轮盘赌的方式选出n对个体\(A_i,B_i,i \in [1,n]\)。
- 交叉:对于每一对个体\(A_i,B_i\),随机选择两个[1,m]之间的数字\(p_1,p_2\),作为两个个体遗传片段的分割点。例如新个体的x基因是由\(A_i\)的前\(p_1\)长的序列和\(B_i\)的后\(m-p_i\)长的序列遗传得到的。
- 变异:对于每个新产生的个体,随机一个[0,1]的数字,若其小于变异概率,则随机选中新个体中的一个基因中的一个单点,对其进行取反操作.
- 用新产生的群体取代上一代的群体.
- 重复3、4、5、6、7步操作T次,T为提前设置好的进化次数。
这样最终群体代表的x、y就是函数\(f(x,y)\)的最大值对应坐标位置。
代码
import numpy as np
import random

from matplotlib import pyplot as plt
from mpl_toolkits.mplot3d import Axes3D

ITERATION_TIME = 100                # 迭代次数
POP_NUM = 100                       # 种群中个体的数量
GENE_LEN = 50                       # 基因的长度
DIMENSION = 2                       # 函数中自变量的个数
BASE = 10.0                         # 加在计算出的函数之中,防止出现函数值为负数的情况
MUTATION_RATE = 2                   # 变异概率
GENE_MAX_VALUE = 1 << GENE_LEN      # 基因能表示的最大值
RANGE = [                           # 函数自变量的范围
    [-6.0, 3.0],
    [-3.0, 6.0]
]

def rand():
    return random.randint(0, 1333331)

class DRAW:
    def __init__(self):
        self.tot = 1

    def fitness(self, x):
        y = x[1]
        x = x[0]
        res = 3 * (1 - x) ** 2 * np.exp(-(x ** 2) - (y + 1) ** 2) - 10 * (x / 5 - x ** 3 - y ** 5) * np.exp(
            -x ** 2 - y ** 2) - 1 / 3 ** np.exp(-(x + 1) ** 2 - y ** 2)
        res += BASE
        return res

    def draw(self, points):
        if DIMENSION != 2:
            return
        fig = plt.figure()
        ax = Axes3D(fig)
        x = np.arange(RANGE[0][0], RANGE[0][1], 0.1)
        y = np.arange(RANGE[1][0], RANGE[1][1], 0.1)
        X, Y = np.meshgrid(x, y)
        Z = self.fitness([X, Y])
        ax = plt.subplot(111, projection='3d')
        ax.plot_surface(X, Y, Z, rstride=1, cstride=1, cmap='rainbow')
        xx, yy, zz = [], [], []
        for i in points:
            xx.append(i[0])
            yy.append(i[1])
            zz.append(self.fitness([i[0], i[1]]))
        ax.scatter(xx, yy, zz)
        ax.set_zlabel('Z')
        ax.set_ylabel('Y')
        ax.set_xlabel('X')
        plt.show()

class POPULATION(DRAW):
    def __init__(self):
        super().__init__()
        self.pop = self.getRandomPop()

    def getRandomPop(self):
        res = []
        for i in range(POP_NUM):
            t = []
            for j in range(DIMENSION):
                t.append([(rand() % 2) for k in range(GENE_LEN)])
            res.append(t)
        return res

    def BinaryToDecimal(self, b):
        res = 0
        for i in b:
            res = res * 2 + i
        return res

    def getDecimal(self):
        Decimal = []
        for unit in self.pop:
            t = []
            for i in range(DIMENSION):
                t.append(self.BinaryToDecimal(unit[i]))
            Decimal.append(t)
        return Decimal

    def decode(self, Decimal):
        DECODE = []
        for i in range(POP_NUM):
            t = []
            for j in range(DIMENSION):
                p = float(Decimal[i][j]) / GENE_MAX_VALUE
                p = (RANGE[j][1] - RANGE[j][0]) * p
                t.append(p + RANGE[j][0])
            DECODE.append(t)
        return DECODE

    def getFitness(self):
        Decimal = self.getDecimal()
        Decimal = self.decode(Decimal)
        fitness = []
        for i in Decimal:
            fitness.append(self.fitness(i))
        return fitness

    def getSelectRate(self):
        fitness = self.getFitness()
        sum = 0.0
        for i in fitness:
            sum = sum + i
        selectRate = []
        for i in fitness:
            selectRate.append(i / sum)
        return selectRate

    def select(self):
        selectRate = self.getSelectRate()
        p = np.random.choice([i for i in range(POP_NUM)], p = selectRate)
        return p

    def mutation(self, unit):
        if (rand() % 100 < MUTATION_RATE):
            r = rand() % DIMENSION
            p = rand() % GENE_LEN
            unit[r][p] = unit[r][p] ^ 1
        return unit

    def crossover(self, t1, t2):
        t1 = self.pop[t1]
        t2 = self.pop[t2]
        t = [t1, t2]
        res = []
        for i in range(DIMENSION):
            p = rand() % GENE_LEN
            tt = []
            r = rand() & 1
            for j in range(p):
                tt.append(t[r][i][j])
            for j in range(p, GENE_LEN):
                tt.append(t[r ^ 1][i][j])
            res.append(tt)
        return res


    def crossover_mutation(self):
        NEW_POP = []
        for j in range(POP_NUM):
            t1 = self.select()
            t2 = self.select()
            t = self.crossover(t1, t2)
            t = self.mutation(t)
            NEW_POP.append(t)
        self.pop = NEW_POP

    def print(self):
        Decimal = self.getDecimal()
        Decimal = self.decode(Decimal)
        res = [0.0 for i in range(DIMENSION)]
        for i in Decimal:
            for j in range(DIMENSION):
                res[j] = res[j] + i[j]
        for i in range(DIMENSION):
            res[i] = res[i] / POP_NUM
        for i in res:
            print(i, end=' ')
        print()


def main():
    pop = POPULATION()
    for i in range(ITERATION_TIME):
        pop.crossover_mutation()
        if i % 2 == 0:
            pop.draw(pop.decode(pop.getDecimal()))
            pop.print()
    pass


if __name__=='__main__':
    main()
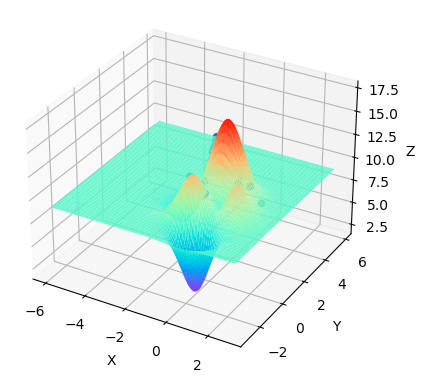
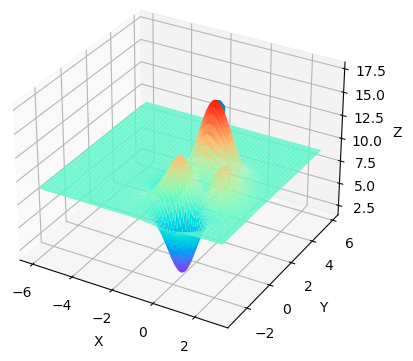
运行结果
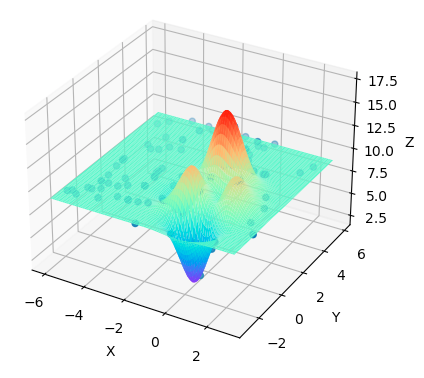
最一开始产生的随机群体,他是随机分布的。
我们目测也大概能看出极值点是在(0, 2)这附近。
最终结果,程序找到极值点在(-0.06622970029525414, 1.8151667597621541)这个位置,与我们目测值相符。

 浙公网安备 33010602011771号