
本节讲解如何预测患者需要佩戴的隐形眼镜类型。
1、使用决策树预测隐形眼镜类型的一般流程
(1)收集数据:提供的文本文件(数据来源于UCI数据库)
(2)准备数据:解析tab键分隔的数据行
(3)分析数据:快速检查数据,确保正确地解析数据内容,使用createPlot()函数绘制最终的树形图
(4)训练算法:createTree()函数
(5)测试算法:编写测试函数验证决策树可以正确分类给定的数据实例
(6)使用算法:存储数的数据结构,以使下次使用时无需重新构造树
trees.py如下:
#!/usr/bin/python
# -*- coding: utf-8 -*-
from math import log
#计算给定数据集的香农熵
def calcShannonEnt(dataSet):
  numEntries=len(dataSet)
  labelCounts={}
  for featVec in dataSet:
      currentLabel=featVec[-1]
      if currentLabel not in labelCounts.keys():
          labelCounts[currentLabel]=0
      labelCounts[currentLabel]+=1
  shannonEnt=0.0
  for key in labelCounts:
      prob=float(labelCounts[key])/numEntries
      shannonEnt -=prob*log(prob,2)
  return shannonEnt
#按照给定特征划分数据集
def splitDataSet(dataSet,axis,value):
    retDataSet=[]
    for featVec in dataSet:
        if featVec[axis]==value:
            reducedFeatVec=featVec[:axis]
            reducedFeatVec.extend(featVec[axis+1:])
            retDataSet.append(reducedFeatVec)
    return retDataSet
#选择最好的数据集划分方式
def chooseBestFeatureToSplit(dataSet):
  numFeatures=len(dataSet[0])-1
  baseEntropy=calcShannonEnt(dataSet)   #计算整个数据集的原始香农熵
  bestInfoGain=0.0;bestFeature=-1
  for i in range(numFeatures):    #循环遍历数据集中的所有特征
    featList=[example[i] for example in dataSet]
    uniqueVals=set(featList)
    newEntropy=0.0
    for value in uniqueVals:
      subDataSet=splitDataSet(dataSet,i,value)
      prob=len(subDataSet)/float(len(dataSet))
      newEntropy+=prob*calcShannonEnt(subDataSet)
    infoGain=baseEntropy-newEntropy
    if(infoGain>bestInfoGain):
      bestInfoGain=infoGain
      bestFeature=i
  return bestFeature
def majorityCnt(classList):
  classCount={}
  for vote in classList:
    if vote not in classCount.keys():classCount[vote]=0
    classCount[vote]+=1
  sortedClassCount=sorted(classCount.iteritems(),key=operator.itemgetter(1),reverse=True)
  return sortedClassCount[0][0]
#创建树的函数代码
def createTree(dataSet,labels):
  classList=[example[-1] for example in dataSet]
  if classList.count(classList[0])==len(classList):  #类别完全相同规则停止继续划分
    return classList[0]
  if len(dataSet[0])==1: return majorityCnt(classList)
  bestFeat=chooseBestFeatureToSplit(dataSet)
  bestFeatLabel=labels[bestFeat]
  myTree={bestFeatLabel:{}}
  del(labels[bestFeat])  #得到列表包含的所有属性
  featValues=[example[bestFeat] for example in dataSet]
  uniqueVals=set(featValues)
  for value in uniqueVals:
    subLabels=labels[:]
    myTree[bestFeatLabel][value]=createTree(splitDataSet(dataSet,bestFeat,value),subLabels)
  return myTree
#测试算法:使用决策树执行分类
def classify(inputTree,featLabels,testVec):
  firstStr=inputTree.keys()[0]
  secondDict=inputTree[firstStr]
  featIndex=featLabels.index(firstStr)
  for key in secondDict.keys():
    if testVec[featIndex]==key:
      if type(secondDict[key]).__name__=='dict':
        classLabel=classify(secondDict[key],featLabels,testVec)
      else:classLabel=secondDict[key]
  return classLabel
#使用算法:决策树的存储
def storeTree(inputTree,filename):
  import pickle
  fw=open(filename,'w')
  pickle.dump(inputTree,fw)
  fw.close()

def grabTree(filename):
  import pickle
  fr=open(filename)
  return pickle.load(fr)
treePlotter.py如下:
#!/usr/bin/python
# -*- coding: utf-8 -*-
import matplotlib.pyplot as plt
from numpy import *
import operator
#定义文本框和箭头格式
decisionNode=dict(boxstyle="sawtooth",fc="0.8")
leafNode=dict(boxstyle="round4",fc="0.8")
arrow_args=dict(arrowstyle="<-")
#绘制箭头的注解
def plotNode(nodeTxt,centerPt,parentPt,nodeType):
    createPlot.ax1.annotate(nodeTxt,xy=parentPt,xycoords='axes fraction',xytext=centerPt,textcoords='axes fraction',va="center",ha="center",bbox=nodeType,arrowprops=arrow_args)
def createPlot():
    fig=plt.figure(1,facecolor='white')
    fig.clf()
    createPlot.ax1=plt.subplot(111,frameon=False)
    plotNode(U'决策节点',(0.5,0.1),(0.1,0.5),decisionNode)
    plotNode(U'叶节点',(0.8,0.1),(0.3,0.8),leafNode)
    plt.show()
#获取叶节点的数目和树的层数
def getNumLeafs(myTree):
    numLeafs=0
    firstStr=myTree.keys()[0]
    secondDict=myTree[firstStr]
    for key in secondDict.keys():
        if type(secondDict[key]).__name__=='dict':
            numLeafs += getNumLeafs(secondDict[key])
        else: numLeafs +=1
    return numLeafs
def getTreeDepth(myTree):
    maxDepth=0
    firstStr=myTree.keys()[0]
    secondDict=myTree[firstStr]
    for key in secondDict.keys():
        if type(secondDict[key]).__name__=='dict':
            thisDepth=1+getTreeDepth(secondDict[key])
        else:thisDepth=1
        if thisDepth>maxDepth:maxDepth=thisDepth
    return maxDepth

def retrieveTree(i):
    listOfTrees=[{'no surfacing':{0:'no',1:{'flippers':{0:'no',1:'yes'}}}},\
                 {'no surfacing':{0:'no',1:{'flippers':{0:{'head':{0:'no',1:'yes'}},1:'no'}}}}]
    return listOfTrees[i]
#在父节点间填充文本信息
def plotMidText(cntrPt,parentPt,txtString):
    xMid=(parentPt[0]-cntrPt[0])/2.0+cntrPt[0]
    yMid=(parentPt[1]-cntrPt[1])/2.0+cntrPt[1]
    createPlot.ax1.text(xMid,yMid,txtString)
#计算宽和高
def plotTree(myTree,parentPt,nodeTxt):
    numLeafs=getNumLeafs(myTree)
    depth=getTreeDepth(myTree)
    firstStr=myTree.keys()[0]
    cntrPt=(plotTree.xOff+(1.0+float(numLeafs))/2.0/plotTree.totalW,plotTree.yOff)
    plotMidText(cntrPt,parentPt,nodeTxt)   #计算父节点和子节点的中间位置
    plotNode(firstStr,cntrPt,parentPt,decisionNode)
    secondDict=myTree[firstStr]
    plotTree.yOff=plotTree.yOff-1.0/plotTree.totalD
    for key in secondDict.keys():
        if type(secondDict[key]).__name__=='dict':
            plotTree(secondDict[key],cntrPt,str(key))
        else:
            plotTree.xOff=plotTree.xOff+1.0/plotTree.totalW
            plotNode(secondDict[key],(plotTree.xOff,plotTree.yOff),cntrPt,leafNode)
            plotMidText((plotTree.xOff,plotTree.yOff),cntrPt,str(key))
        plotTree.yOff=plotTree.yOff+1.0/plotTree.totalD
def createPlot(inTree):
    fig=plt.figure(1,facecolor='white')
    fig.clf()
    axprops=dict(xticks=[],yticks=[])
    createPlot.ax1=plt.subplot(111,frameon=False,**axprops)
    plotTree.totalW=float(getNumLeafs(inTree))
    plotTree.totalD=float(getTreeDepth(inTree))
    plotTree.xOff=-0.5/plotTree.totalW;plotTree.yOff=1.0;
    plotTree(inTree,(0.5,1.0),'')
    plt.show()
lenses.txt如下:
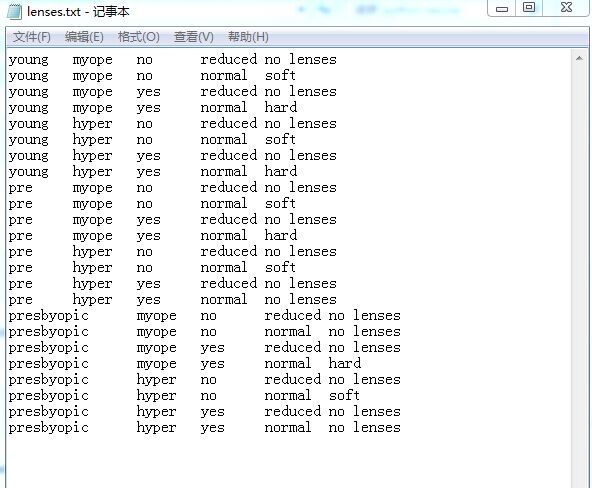
运行如下:
1 >>> import trees
2 >>> import treePlotter
3 >>> fr=open('lenses.txt')
4 >>> lenses=[inst.strip().split('\t') for inst in fr.readlines()]
5 >>> lensesLabels=['age','prescript','astigmatic','tearRate']
6 >>> lensesTree=trees.createTree(lenses,lensesLabels)
7 >>> lensesTree
8 {'tearRate': {'reduced': 'no lenses', 'normal': {'astigmatic': {'yes': {'prescript': {'hyper': {'age': {'pre': 'no lenses', 'presbyopic': 'no lenses', 'young': 'hard'}}, 'myope': 'hard'}}, 'no': {'age': {'pre': 'soft', 'presbyopic': {'prescript': {'hyper': 'soft', 'myope': 'no lenses'}}, 'young': 'soft'}}}}}}
9 >>> treePlotter.createPlot(lensesTree)
由图看出决策树非常好地匹配了实验数据,然而这些匹配选项可能太多。我们将这种问题称之为过度匹配(overfitting)。为了减少过度匹配问题,我们可以裁剪决策树,去掉一些不必要的叶子节点。如果叶子节点只能增加少许信息,则可以删除该节点,将它并入到其他叶子节点中。

 浙公网安备 33010602011771号