对压力数据进行快速傅里叶变换(FFT)--Matlab vs Tecplot
从DNS数据中提取出了压力数据,我想对其进行傅里叶变换,看看在频域里能否找到一些关于压力的有用的信息。我分别用了Matlab和Tecplot进行傅里叶变换,并对结果进行了比较,二者得到了一致的结果。现将过程记录一下。
Matlab:
Matlab提供了现成的傅里叶变换工具:fft,在开始变换前,需要将数据的直流分量(DC),(对我的case来说)也就是压力的平均值减去,否则FFT之后会在0Hz频率处有一个很强的频率分量,有可能会导致其他频率分量被淹没。
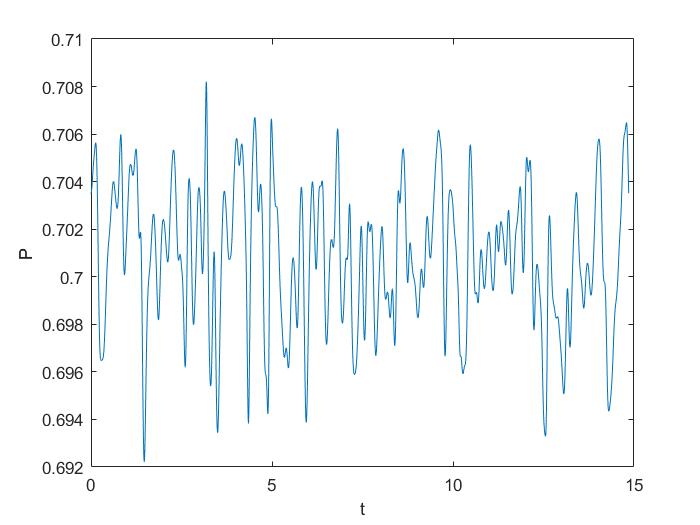
图1. 压力随时间的变化
图1 显示了将要进行傅里叶变换的压力数据。
首先用Matlab进行傅里叶变换。
dt = 7.7e-5 % DNS中的时间步长
freq_save = 100 % 数据保存频率为100,即100个时间步(dt)保存一次
由此可以计算出,我的采样周期为:
T = dt * freq_save = 7.7e-5 * 100 = 0.0077
那么采样频率为:
Fs = 1 / T = 130
代码:
 1 %% load pressure data and plot it
 2 clc;
 3 clear all;
 4 close all;
 5
 6 delt_t=5;  % = c/u_infinity = 1/0.2 = 5, reference time
 7
 8 load('time_pressure_1-7.mat')
 9 load('time_pressure_8-15.mat')
10 P=[time_pressuer_1_7(:,2:8) time_pressuer_8_15(:,2:9)];
11 time=(time_pressuer_1_7(:,1)-time_pressuer_1_7(1,1))*delt_t; % real time
12
13 tap_pressure = P(:,9);
14
15 figure
16 plot(time, tap_pressure)
17
18 Fs = 130;   % 1 / (7.7*e-5*100)
19 T = 1/Fs;
20 L = length(tap_pressure);
21
22 P_mean = mean(tap_pressure); % the mean value will appear in the 0Hz of fft with a peak value
23                        % need to be removed from the original data
24
25 fft_p = fft(tap_pressure-P_mean); % detrent the data, remove the mean value
26 p2 = abs(fft_p/L); % amplitude
27 p1 = p2(1:L/2+1); % single side amplitude
28 p1(2:end-1) = 2*p1(2:end-1);
29
30 f = Fs*(0:(L/2))/L;
31 figure
32 plot(f(1:150),p1(1:150)) % here I just plot the low frequency components, thee is nearly no high frequence components
33 title('single-sided amplitude spectrum of y')
34 xlabel('f (Hz)')
35 ylabel('|p1(f)|')
36
37 [m,n] = max(p1);
38 peak_freq = f(n); % find the peak frequence
代码中有相应的解释。
上图:
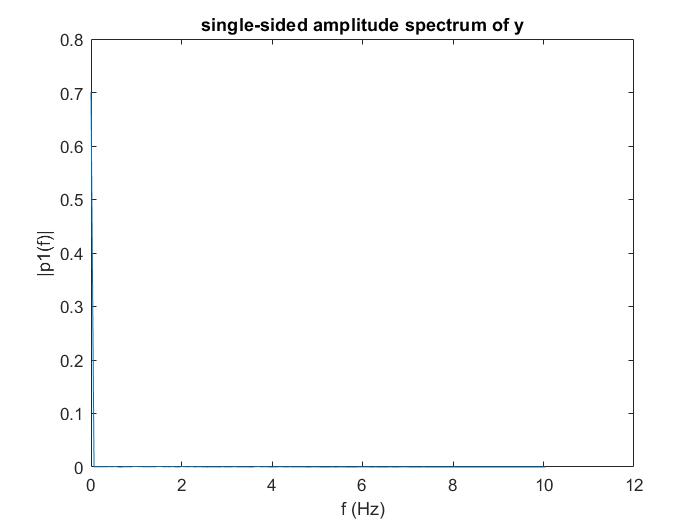
(a) fft for original pressure
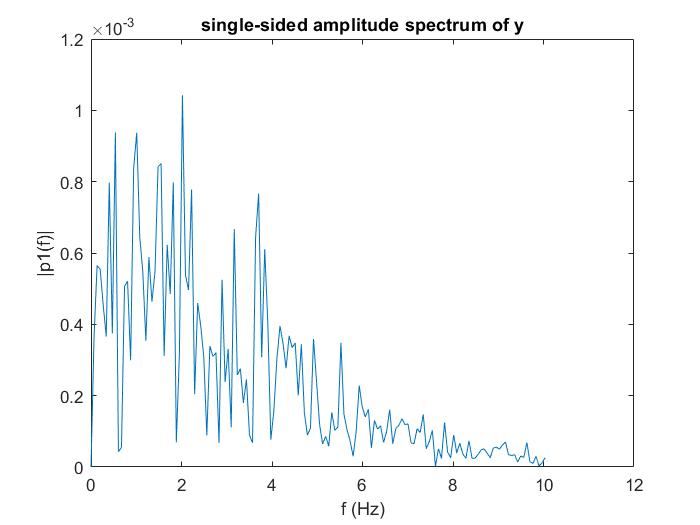
(b) fft after remove the mean pressure
图2 频域中的压力
图2(a)是没有减去压力平均值的fft,可以看到 0Hz 频率处有一个峰值,这个峰值其实对应的就是压力的平均值(数据的直流分量),因为平均值很大(相对),导致其他频率分量完全被淹没,观察不到。(b) 就是去除平均值之后的fft,0Hz 频率处不再有峰值, 其他频率分量也都显示了出来。横坐标是频率,纵坐标表示各频率分量的幅值。
Tecplot:
Tecplot中做傅里叶变换(fft)要相对简单一些,在做变换之前同样需要减去压力的平均值。在Tecplot中,可以用积分的方法计算某个量的平均值。
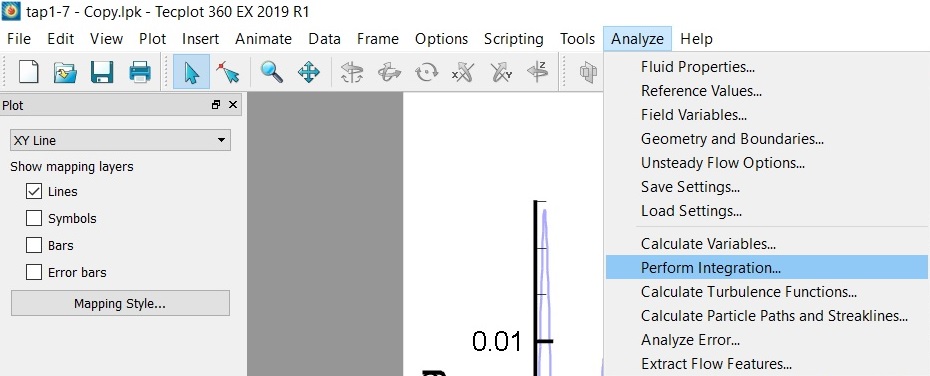
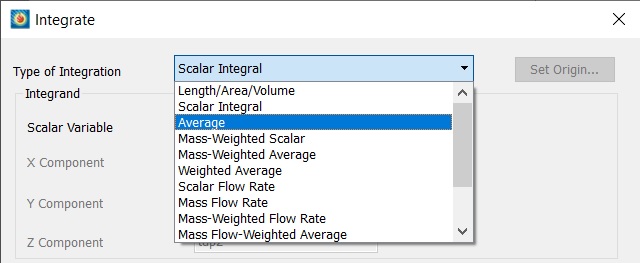
利用 Analysis -- Perform Integration 选项,type选择average,求平均值。再利用自定义公式求出减去平均值后的脉动压力。
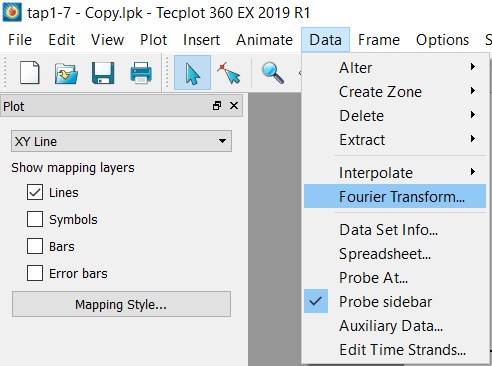
然后,选择Data -- Fourier Transform,进行傅里叶变换,注意选择正确的自变量和因变量。
上图:
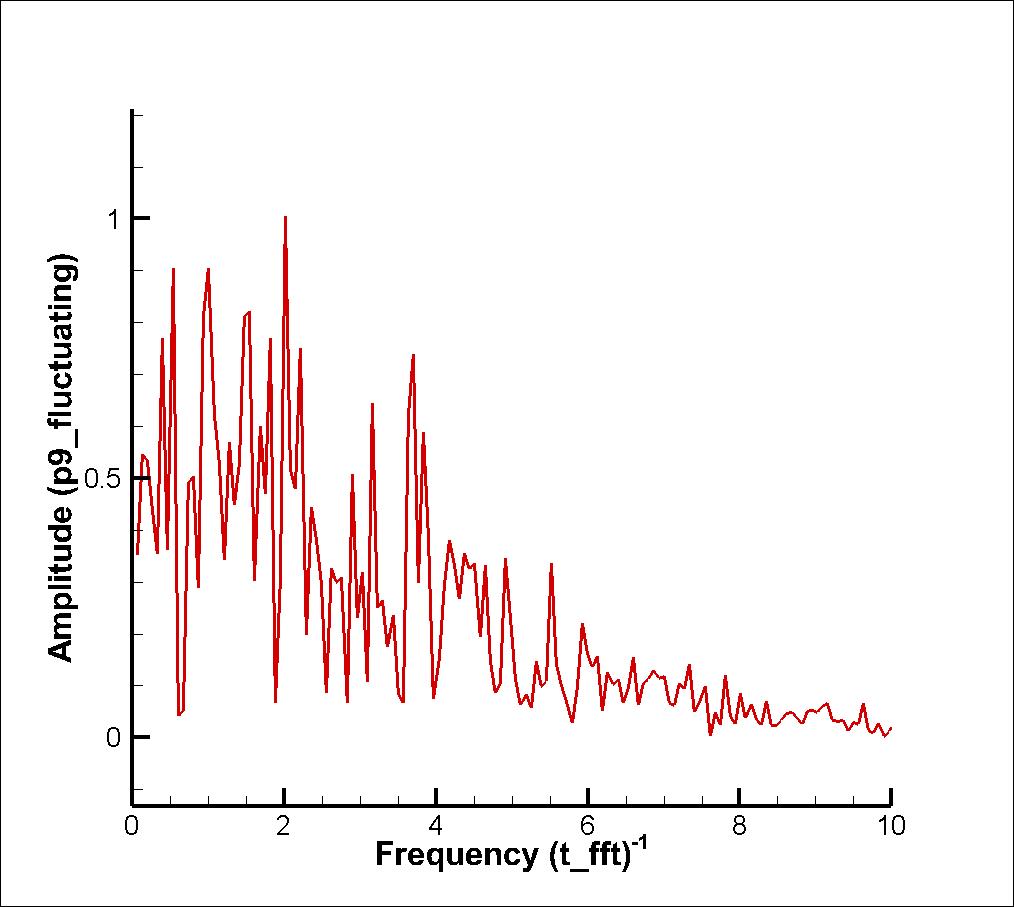
可以看到Tecplot得到了和Matlab相同的结果。

 浙公网安备 33010602011771号