二维绘图(3.1.3)
二维绘图
同一个轴上绘制多个绘图
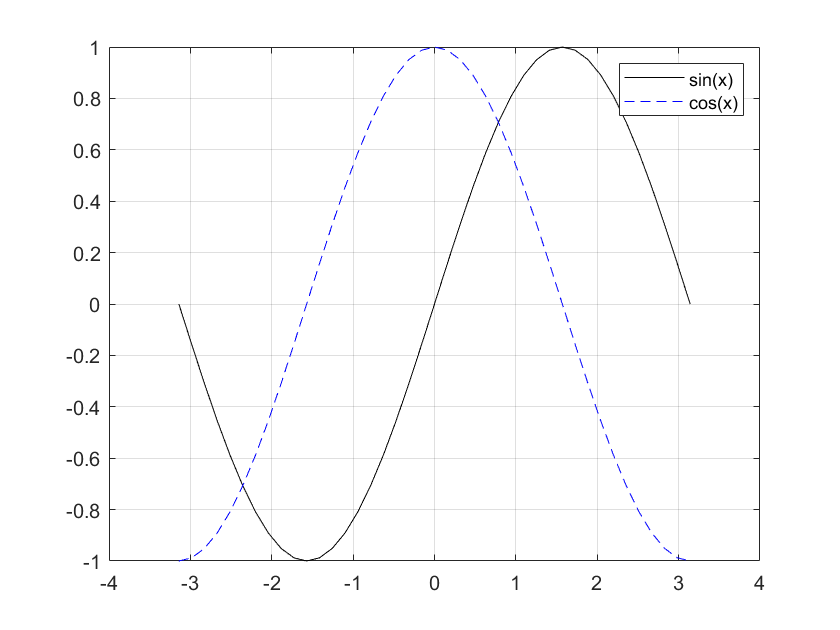
*使用hold on命令,所有另外的绘图都会保留在原先绘图之上。
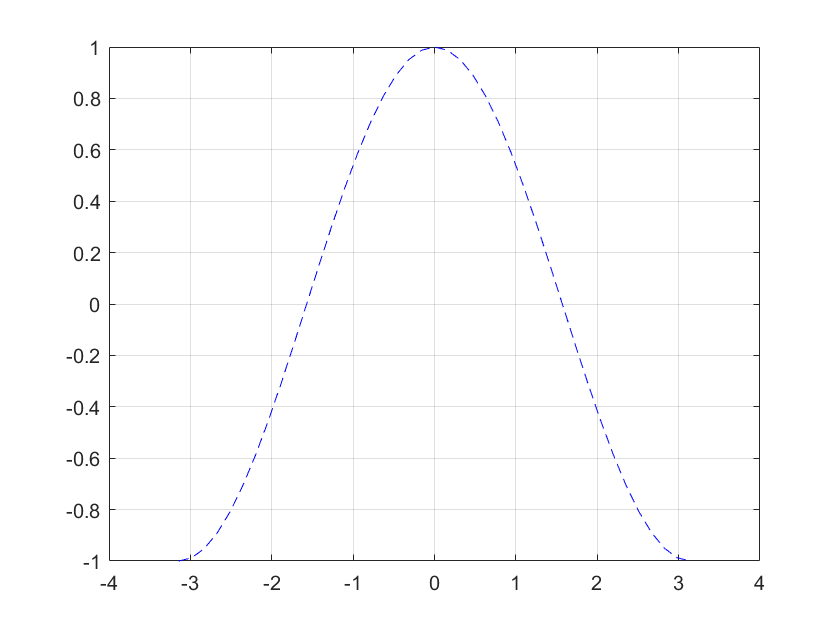
*使用hold off命令,新绘图将替代原绘图。
%以绘制函数sin(x)和cos(x)为例。
x = - pi : pi / 20 : pi;
y1 = sin(x);
y2 = cos(x);
plot(x,y1,'k-');
hold off;
plot(x,y2,'b--');
grid on;

%以绘制函数sin(x)和cos(x)为例。
x = - pi : pi / 20 : pi;
y1 = sin(x);
y2 = cos(x);
plot(x,y1,'k-');
hold on;
plot(x,y2,'b--');
hold off;
legend("sin(x)","cos(x)");
grid on;

本文来自博客园,作者:闲晚,转载请注明原文链接:https://www.cnblogs.com/centimeter73/p/15489988.html


