如何科学地评估和评判深度学习模型?
最近在考虑要发Paper,在模型的性能比较中,除了采用Precision/Recall的比较之外,为了进一步验证论文中的选择是存在可证明性的,因此考虑了使用F-test对多种模型算法进行统计显著性检验。
常见的模型评估与方法
- 误分率(misclassification rate),即准确度。
- 精确率(precision)和召回率(recall)
- 计算F1
- ROC曲线,ROC_AUC
- k-fold cross-validation
以上这些方法都能为模型的评估和选择提供有利的帮助,但是有时候会存在几个模型精度相差不多,无法科学的评判选择的情况。此时,为了更进一步的检验其显著性,统计显著性检验的方法就起到很好的的作用。
常用的显著性检验方法
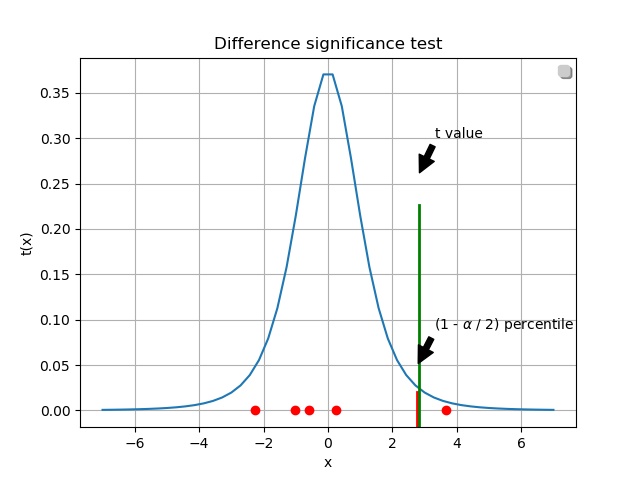
Student's t-test
通过小样本来对总体均值或者总体之间均值的差异的推断通常使用t检验。
一般常用双总体t检验,two-sample t-test 。 来检验总体的均值的差异是否显著。
检验统计量为:
F-test
F检验又叫方差齐性检验。在两样本t检验中要用到F检验。
从两研究总体中随机抽取样本,要对这两个样本进行比较的时候,首先要判断两总体方差是否相同,即方差齐性。若两总体方差相等,则直接用t检验,若不等,可采用t'检验或变量变换或秩和检验等方法。
其中要判断两总体方差是否相等,就可以用F检验。
假设检验中 P<0.05通常说明了统计学显著性差异。
实现
该实验背景是根据某个工业场景,选择了一些通用模型进行训练。将数据集按照class进行分层采样成5子样本。分别使用7种不同的模型对5个子样本进行训练和检测识别。经过实验后得到一些实验数据,发现存在几种模型的precision和recall相差不多,此时在没有检测速度比较的的情况,如何科学地表达这几种模型的表现力。即统计显著性检验。
由于论文还没在待审核中,为了保证论文的正常审核,对真实的实验数据做了大的修改!!!但是不影响对显著性检验的学习~
f-test具体的实现如下:
def F_test(sample, mean_list, modify_std_list):
    """
    统计显著性检验
    :param mean_list:
    :param modify_std_list:
    :return:
    """
    statistic_list = []
    pvalue_list = []
    type_list = []
    model1_list = []
    model2_list = []
    result = {}
    cout = 1
    # 统计显著性检验
    for i in range(len(Model)):
        for j in range(len(Model)):

            (statistic, pvalue) = stats.ttest_ind_from_stats(mean1=mean_list[i], std1=modify_std_list[i], nobs1=5,
                                                             mean2=mean_list[j],
                                                             std2=modify_std_list[j], nobs2=5)
            if pvalue < 0.05:
                type_list.append("Reject NULL hypothesis - Significant differences exist between groups.")
            else:
                type_list.append("Accept NULL hypothesis - No significant difference between groups.")

            model1_list.append(Model[i])
            model2_list.append(Model[j])
            statistic_list.append(statistic)
            pvalue_list.append(pvalue)

            print(
                "第 {} 对比检验组合:第 {} 个 mean:{},第 {} 个 modify_std:{}".format(cout, i, mean_list[i], j,
                                                                         modify_std_list[j]))
            print("------------第{}次迭代完成!----------".format(cout))
            cout += 1
    result = {"model1": model1_list, "model2": model2_list,
              "pvalue": pvalue_list, "statistic": statistic_list,
              "result": type_list}
    pd.DataFrame(result).to_csv('result.csv', index=False)
    return result
热力图可视化:
def plt_show(result):
    """
    可视化
    :param result:
    :return:
    """
    df = pd.read_csv('result.csv')
    print(df['pvalue'])
    # 将表格数据转化成矩阵图
    df = df.pivot("model1", 'model2', "pvalue")
    print(df)
    f, ax = plt.subplots(figsize=(9, 7))
    # grid_kws = {"height_ratios": (.9, .05), "hspace": .5}
    ax = sns.heatmap(df, ax=ax, vmin=0, vmax=0.05, cmap="GnBu", square=False,
                     xticklabels=['M1', 'M2', 'M3', 'M4', 'M5', 'M6', 'M7'],
                     yticklabels=['M1', 'M2', 'M3', 'M4', 'M5', 'M6', 'M7'],
                     center=df.loc['Faster RCNN+InceptionV2', 'SSD+MobileNetV1'],
                     annot=True, fmt='.2g', annot_kws={'size': 10, 'color': 'black', "ha": 'center', "va": 'center'})

    label_y = ax.get_yticklabels()
    plt.setp(label_y, rotation=360, horizontalalignment='right')
    label_x = ax.get_xticklabels()
    plt.setp(label_x, rotation=360, horizontalalignment='right')
    plt.xlabel('Model')  # 设置坐标名称
    plt.ylabel('Model')
    plt.savefig("f-test.jpg")
    plt.show()
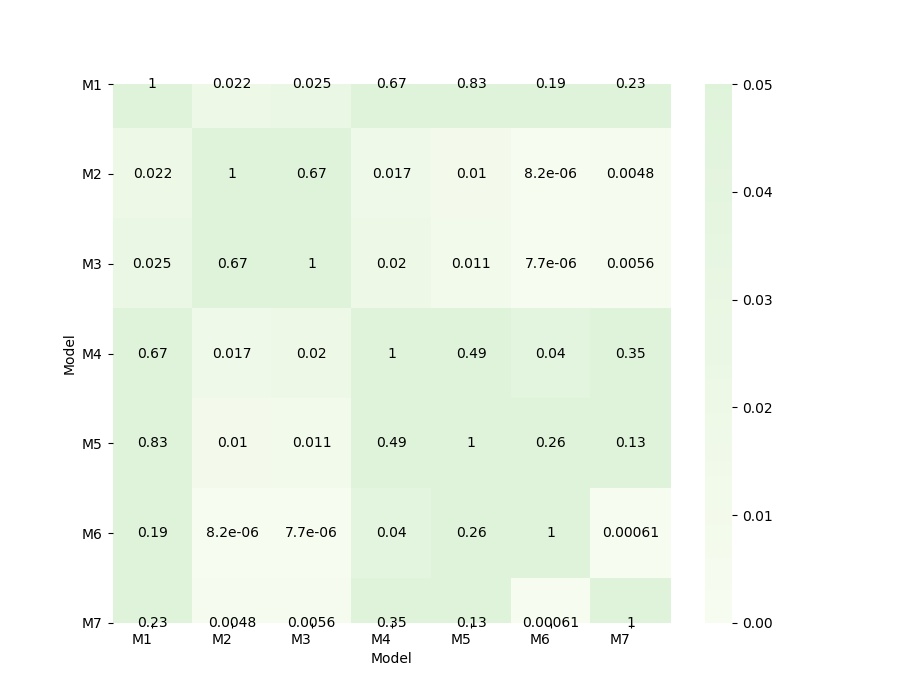
最后的结果:(以上只存放了一些主要代码~)
在热力图中,如果p值大于0.05,表示两个模型之间的显著性差异不大,反之,显著性差异比较大,有很大不同。


最后希望自己的论文能够顺利地成功发表!哈哈~😄


