【LiveCharts2】 笛卡儿积图 Zooming And Panning
官方网站:https://lvcharts.com/docs/WPF/2.0.0-beta.700/samples.axes.dateTimeScaled
1、nuget 添加以下三个包
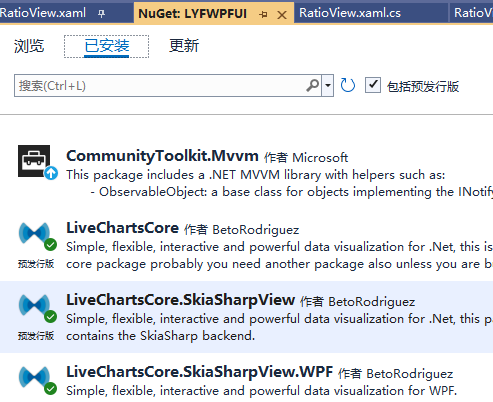
效果图1
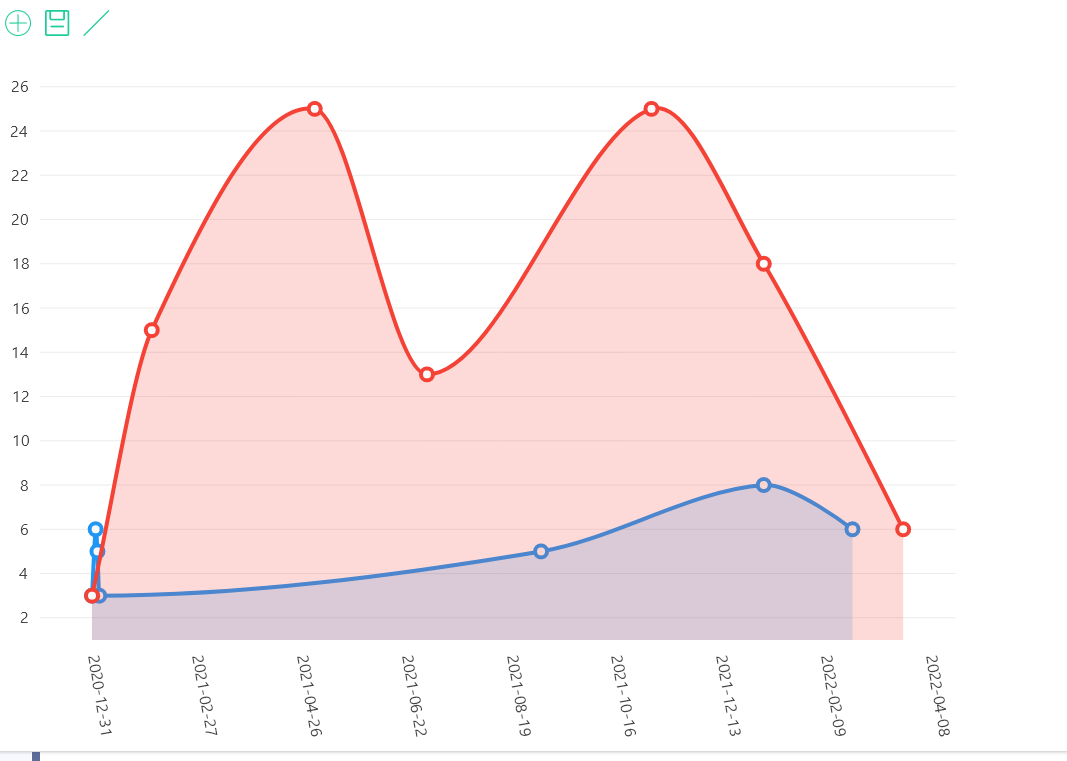
ViewModel设置如下:
using CommunityToolkit.Mvvm.ComponentModel;
using LiveChartsCore;
using LiveChartsCore.Defaults;
using LiveChartsCore.SkiaSharpView;
using LiveChartsCore.SkiaSharpView.Painting;
using SkiaSharp;
using System;
using System.Collections.Generic;
using System.Collections.ObjectModel;
using System.Linq;
using System.Text;
using System.Threading.Tasks;

namespace LYFWPFUI.MVVM.ViewModels
{

    [ObservableObject]
    public partial class RatioViewModel
    {
        public ISeries[] Series { get; set; }
        public Axis[] XAxes { get; set; }
        public RatioViewModel()
        {
            //
            Series = new ISeries[]
               {
                   new LineSeries<DateTimePoint>
        {
            TooltipLabelFormatter = (chartPoint) =>
                $"{new DateTime((long) chartPoint.SecondaryValue):MMMM dd}: {chartPoint.PrimaryValue}",
            Values = new ObservableCollection<DateTimePoint>
            {
                new DateTimePoint(new DateTime(2021, 1, 1), 3),
                // notice we are missing the day new DateTime(2021, 1, 2)
                new DateTimePoint(new DateTime(2021, 1, 3), 6),
                new DateTimePoint(new DateTime(2021, 1, 4), 5),
                new DateTimePoint(new DateTime(2021, 1, 5), 3),
                new DateTimePoint(new DateTime(2021, 9, 6), 5),
                new DateTimePoint(new DateTime(2022, 1, 7), 8),
                new DateTimePoint(new DateTime(2022, 2, 25), 6)
            }
        },
                   new LineSeries<DateTimePoint>
        {
            TooltipLabelFormatter = (chartPoint) =>
                $"{new DateTime((long) chartPoint.SecondaryValue):MMMM dd}: {chartPoint.PrimaryValue}",
            Values = new ObservableCollection<DateTimePoint>
            {
                new DateTimePoint(new DateTime(2021, 1, 1), 3),
                // notice we are missing the day new DateTime(2021, 1, 2)
                new DateTimePoint(new DateTime(2021, 2, 3), 15),
                new DateTimePoint(new DateTime(2021, 5, 4), 25),
                new DateTimePoint(new DateTime(2021, 7, 5), 13),
                new DateTimePoint(new DateTime(2021, 11, 6), 25),
                new DateTimePoint(new DateTime(2022, 1, 7), 18),
                new DateTimePoint(new DateTime(2022, 3, 25), 6)
            }
        }
               };

            //x轴设置
             XAxes = new Axis[]
             {
                 new Axis
                {
                      Labeler = value => new DateTime((long) value).ToString("yyyy-MM-dd"),
                      LabelsRotation = 80,

                      // when using a date time type, let the library know your unit
                      UnitWidth = TimeSpan.FromDays(1).Ticks,

                       // if the difference between our points is in hours then we would:
                       // UnitWidth = TimeSpan.FromHours(1).Ticks,

                      // since all the months and years have a different number of days
                      // we can use the average, it would not cause any visible error in the user interface
                     // Months: TimeSpan.FromDays(30.4375).Ticks
                     // Years: TimeSpan.FromDays(365.25).Ticks

                     // The MinStep property forces the separator to be greater than 1 day.
                        MinStep = TimeSpan.FromDays(1).Ticks
        }
              };
        }

    }

}
xaml
        <lvc:CartesianChart  Grid.Row="1"
            Series="{Binding Series}"
            TooltipPosition="Hidden"
            XAxes="{Binding XAxes}"

            ZoomMode="X"></lvc:CartesianChart>
效果图2
点集合:Values = new [] { 7, 5, 3, 2, 6 },
壁画的大小和颜色:Stroke = new SolidColorPaint(SKColors.Red) { StrokeThickness = 8 },
填充色:Fill = null,
点的图形:GeometryFill = null,
点的图形笔画:GeometryStroke = null
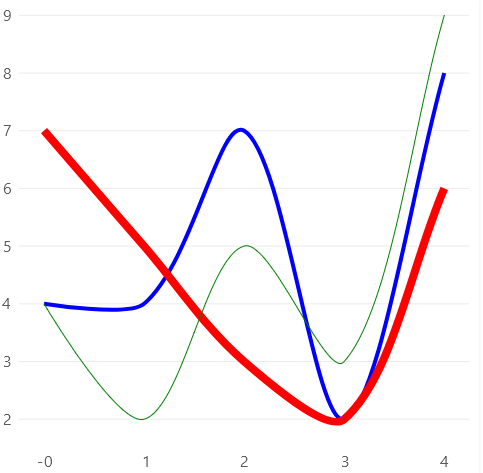
Series = new ISeries[]
{
    new LineSeries<int>
    {
        Values = new [] { 4, 4, 7, 2, 8 },
        Stroke = new SolidColorPaint(SKColors.Blue) { StrokeThickness = 4 },
        Fill = null,
        GeometryFill = null,
        GeometryStroke = null
    },
    new LineSeries<int>
    {
        Values = new [] { 7, 5, 3, 2, 6 },
        Stroke = new SolidColorPaint(SKColors.Red) { StrokeThickness = 8 },
        Fill = null,
        GeometryFill = null,
        GeometryStroke = null
    },
    new LineSeries<int>
    {
        Values = new [] { 4, 2, 5, 3, 9 },
        Stroke = new SolidColorPaint(SKColors.Green) { StrokeThickness = 1 },
        Fill = null,
        GeometryFill = null,
        GeometryStroke = null
    }
};
参考:https://lvcharts.com/docs/wpf/2.0.0-beta.700/CartesianChart.Line%20Series%20props
编程是个人爱好

 浙公网安备 33010602011771号