
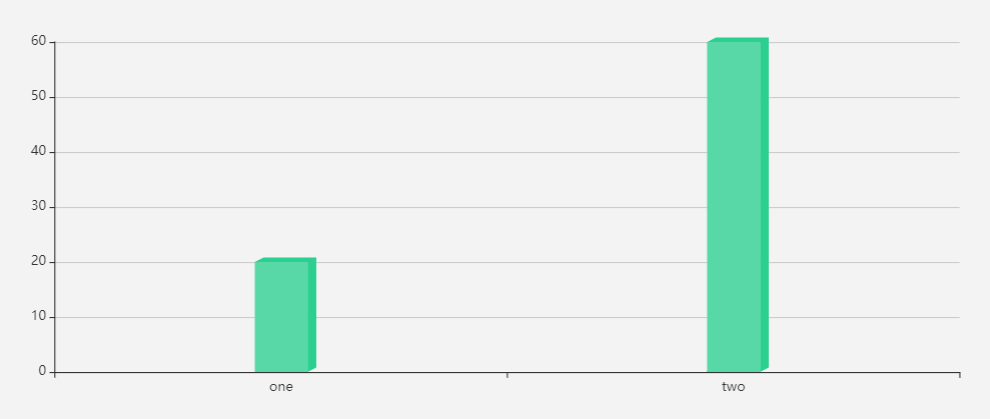
echarts custom 实现立体柱状图
成品图:
先上一个连接,解释一下:https://www.w3cschool.cn/echarts_tutorial/echarts_tutorial-znms2i2b.html
完整代码:
var MyCubeRect = echarts.graphic.extendShape({
shape: {
x: 0,
y: 0,
width: 48, //柱宽
zWidth: 8, //阴影折角宽
zHeight: 4, //阴影折角高
},
buildPath: function (ctx, shape) {
const api = shape.api;
const xAxisPoint = api.coord([shape.xValue, 0]);
const p0 = [shape.x, shape.y];
const p1 = [shape.x - shape.width/2, shape.y];
const p4 = [shape.x + shape.width/2, shape.y];
const p2 = [xAxisPoint[0] - shape.width/2, xAxisPoint[1]];
const p3 = [xAxisPoint[0] + shape.width/2, xAxisPoint[1]];
ctx.moveTo(p0[0], p0[1]); //0
ctx.lineTo(p1[0], p1[1]); //1
ctx.lineTo(p2[0], p2[1]); //2
ctx.lineTo(p3[0], p3[1]); //3
ctx.lineTo(p4[0], p4[1]); //4
ctx.lineTo(p0[0], p0[1]); //0
ctx.closePath();
}
});
var MyCubeShadow = echarts.graphic.extendShape({
shape: {
x: 0,
y: 0,
width: 48,
zWidth: 8,
zHeight: 4,
},
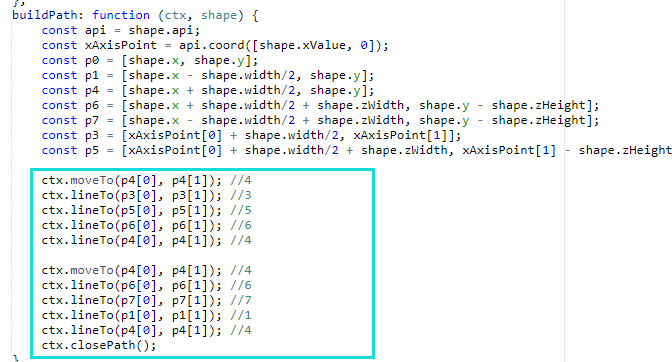
buildPath: function (ctx, shape) {
const api = shape.api;
const xAxisPoint = api.coord([shape.xValue, 0]);
const p0 = [shape.x, shape.y];
const p1 = [shape.x - shape.width/2, shape.y];
const p4 = [shape.x + shape.width/2, shape.y];
const p6 = [shape.x + shape.width/2 + shape.zWidth, shape.y - shape.zHeight];
const p7 = [shape.x - shape.width/2 + shape.zWidth, shape.y - shape.zHeight];
const p3 = [xAxisPoint[0] + shape.width/2, xAxisPoint[1]];
const p5 = [xAxisPoint[0] + shape.width/2 + shape.zWidth, xAxisPoint[1] - shape.zHeight];
ctx.moveTo(p4[0], p4[1]); //4
ctx.lineTo(p3[0], p3[1]); //3
ctx.lineTo(p5[0], p5[1]); //5
ctx.lineTo(p6[0], p6[1]); //6
ctx.lineTo(p4[0], p4[1]); //4
ctx.moveTo(p4[0], p4[1]); //4
ctx.lineTo(p6[0], p6[1]); //6
ctx.lineTo(p7[0], p7[1]); //7
ctx.lineTo(p1[0], p1[1]); //1
ctx.lineTo(p4[0], p4[1]); //4
ctx.closePath();
}
});
echarts.graphic.registerShape('MyCubeRect', MyCubeRect);
echarts.graphic.registerShape('MyCubeShadow', MyCubeShadow);
option = {
grid: {
height: 300
},
xAxis: {
data: ['one', 'two']
},
yAxis: {
type: 'value'
},
series: [{
type: 'custom',
renderItem: function (params, api) {
let location = api.coord([api.value(0), api.value(1)]);
return {
type: 'group',
children: [{
type: 'MyCubeRect',
shape: {
api,
xValue: api.value(0),
yValue: api.value(1),
x: location[0],
y: location[1]
},
style: {
fill: '#5AD8A6'
}
},{
type: 'MyCubeShadow',
shape: {
api,
xValue: api.value(0),
yValue: api.value(1),
x: location[0],
y: location[1]
},
style: {
fill: '#2DCF8E'
}
}]
};
},
data: [20, 60]
}]
};
代码逻辑:
关于这两个api在官网有解释:
https://www.echartsjs.com/zh/api.html#echarts.graphic.extendShape
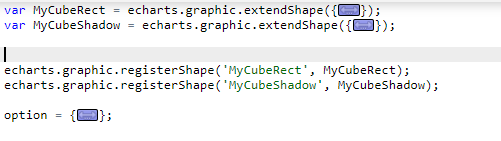
extendShape是定义自己的图形。
registerShape是将自己定义的图形在echarts中注册
然后在option中调用自己注册的图形渲染
参数参考:
https://ecomfe.github.io/zrender-doc/public/api.html#zrender-api
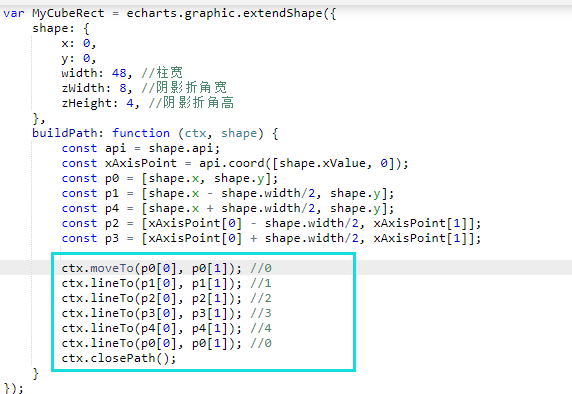
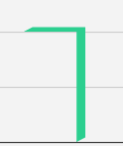
蓝框内就是canvans绘图逻辑,绘制图形路径效果如下
buildPath即绘制路径这是Canvans内容两个参数cxt就是canvans绘图对象。shape就是自己定义的。
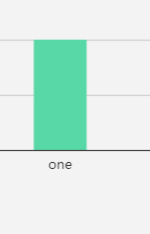
同样的绘制图形
绘制图形效果
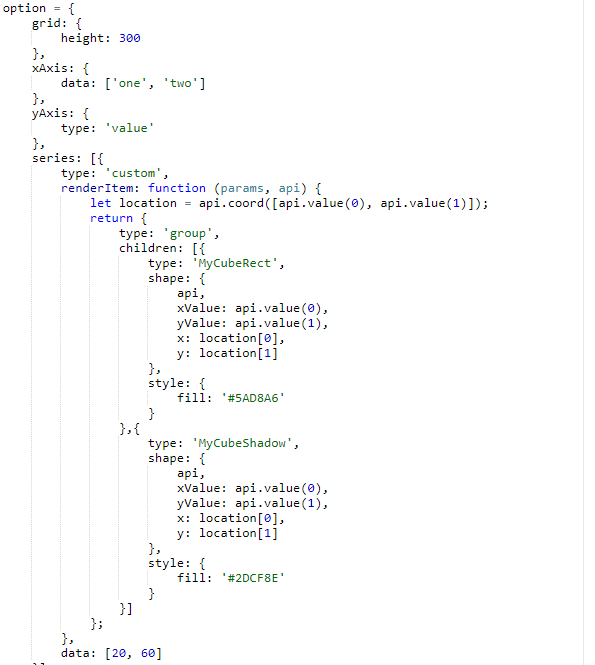
在series中调用这两个图形渲染完成
renderItem:https://www.echartsjs.com/zh/option.html#series-custom.renderItem

 浙公网安备 33010602011771号