深度学习-卷积神经网络-Faster RCNN anchor详解-53
参考:https://zhuanlan.zhihu.com/p/86403390?utm_id=0
1. Anchor
我第一次接触Anchor(中文叫做锚)的时候,比较懵逼的,什么是锚这个问题让思考了好久,这也是阻碍大家学习FasterRCNN最大的绊脚石
索性我们就先把anchor理解为一个个按照固定比例(长宽、大小)预定义的框
lib/nets/vgg16.py
def _anchor_component(self):  #获得锚的数量和位置
    with tf.variable_scope('ANCHOR_' + 'default'):
        # just to get the shape right  只是为了让形状正确
        height = tf.to_int32(tf.ceil(self._im_info[0, 0] / np.float32(self._feat_stride[0]))) #高度为图片高/16,,就是特征图的高,tf.ceil向上取整
        width = tf.to_int32(tf.ceil(self._im_info[0, 1] / np.float32(self._feat_stride[0]))) #宽度为图片宽/16,为特征图的宽
        anchors, anchor_length = tf.py_func(generate_anchors_pre,
                                            [height, width,
                                             self._feat_stride, self._anchor_scales, self._anchor_ratios],
                                            [tf.float32, tf.int32], name="generate_anchors")  #构建生成锚的py函数,这个锚有9*(50*38)个,anchor_length是锚的个数
        anchors.set_shape([None, 4])  #锚定义为4列
        anchor_length.set_shape([]) #行向量,length为锚的个数
        self._anchors = anchors
        self._anchor_length = anchor_length  #length为特征图面积*9
接着,这里就该生成anchor了,这里通过一个函数generate_anchors_pre来生成的,我们进入函数中。
def generate_anchors_pre(height, width, feat_stride, anchor_scales=(8, 16, 32), anchor_ratios=(0.5, 1, 2)):
    """ A wrapper function to generate anchors given different scales
      Also return the number of anchors in variable 'length' 给定不同比例生成锚点的包装函数也返回可变“长度”的锚点数量
    """
    anchors = generate_anchors(ratios=np.array(anchor_ratios), scales=np.array(anchor_scales))
    A = anchors.shape[0] #anchor的数量,为9
    shift_x = np.arange(0, width) * feat_stride  #将特征图的宽度进行16倍延伸至原图,以width=4为例子,则shfit_x=[0,16,32,48]
    shift_y = np.arange(0, height) * feat_stride  #将特征图的高度进行16倍衍生至原图
    shift_x, shift_y = np.meshgrid(shift_x, shift_y)  #生成原图的网格点
    shifts = np.vstack((shift_x.ravel(), shift_y.ravel(), shift_x.ravel(), shift_y.ravel())).transpose()  #若width=50,height=38,生成(50*38)*4的数组
    #如 [[0,0,0,0],[16,0,16,0],[32,0,32,0].......],shift中的前两个坐标和后两个一样(保持右下和左上的坐标一样),是从左到右,从上到下的坐标点(映射到原图)
    K = shifts.shape[0]  #k=50*38
    # width changes faster, so here it is H, W, C
    anchors = anchors.reshape((1, A, 4)) + shifts.reshape((1, K, 4)).transpose((1, 0, 2))  #列数相同的list相加就是简单的添加,而数组不一样,1*9*4和(50*38)*1*4进行相加,生成了(50*38)*9*4的数组
    #其实意思就是右下角坐标和左上角的左边都加上同一个变换坐标
    anchors = anchors.reshape((K * A, 4)).astype(np.float32, copy=False) #三维变两维,(50*38*9,4),此处就是将特征层的anchor坐标转到原图上的区域
    length = np.int32(anchors.shape[0])  #length=50*38*9

    return anchors, length
anchors = generate_anchors(ratios=np.array(anchor_ratios),scales=np.array(anchor_scales))
进入函数generate_anchors中,发现其实生成就是一个数组,这个数组是
# array([[ -83.,  -39.,  100.,   56.],
#       [-175.,  -87.,  192.,  104.],
#       [-359., -183.,  376.,  200.],
#       [ -55.,  -55.,   72.,   72.],
#       [-119., -119.,  136.,  136.],
#       [-247., -247.,  264.,  264.],
#       [ -35.,  -79.,   52.,   96.],
#       [ -79., -167.,   96.,  184.],
#       [-167., -343.,  184.,  360.]])
def generate_anchors(base_size=16, ratios=[0.5, 1, 2],
                     scales=2 ** np.arange(3, 6)):
    """
    Generate anchor (reference) windows by enumerating aspect ratios X
    scales wrt a reference (0, 0, 15, 15) window.  通过枚举参考(0,0,15,15)窗口的长宽比来生成锚(参考)窗口。
    """

    base_anchor = np.array([1, 1, base_size, base_size]) - 1  #生成一个base_anchor = [0, 0, 15, 15],其中(0, 0)是anchor左上点的坐标
    # (15, 15)是anchor右下点的坐标,那么这个anchor的中心点的坐标是(7.5, 7.5)
    ratio_anchors = _ratio_enum(base_anchor, ratios)#然后产生ratio_anchors,就是将base_anchor和ratios[0.5, 1, 2],ratio_anchors生成三个anchors
    # 传入到_ratio_enum()函数,ratios代表的是三种宽高比。
    anchors = np.vstack([_scale_enum(ratio_anchors[i, :], scales)  #在刚刚3个anchor基础上继续生成anchor
                         for i in range(ratio_anchors.shape[0])])
    return anchors
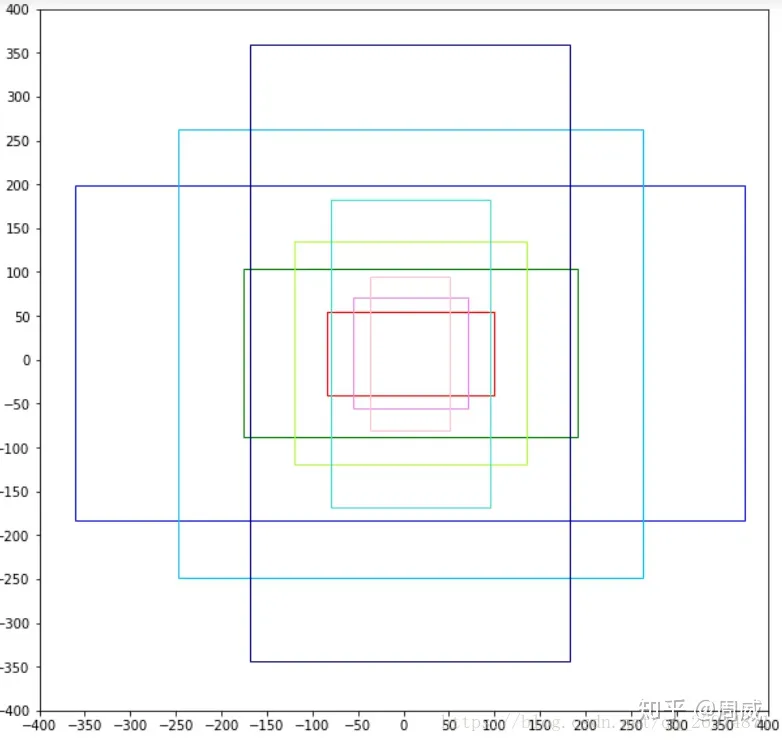
我们发现这个数组中的每行数据(如第一行:[ -83., -39., 100., 56.] ),它们的中心位置都为(7.5,7.5),即(0,0,15,15)的中心
通过代码也可以得知,这9个基础框的生成也是以(0,0,15,15)为基础的,代码中base_anchor就是(0,0,15,15)
3种anchor ratio和3种anchor scale生成的9个数组
一张图片通过特征提取网路VGG16后,长宽比都缩小了16倍得到了特征图。比如原先的800600的原图通过VGG16后得到了5038的特征图
我们就假设,特征图上的每一个点(大小为11),和原图1616区域对应
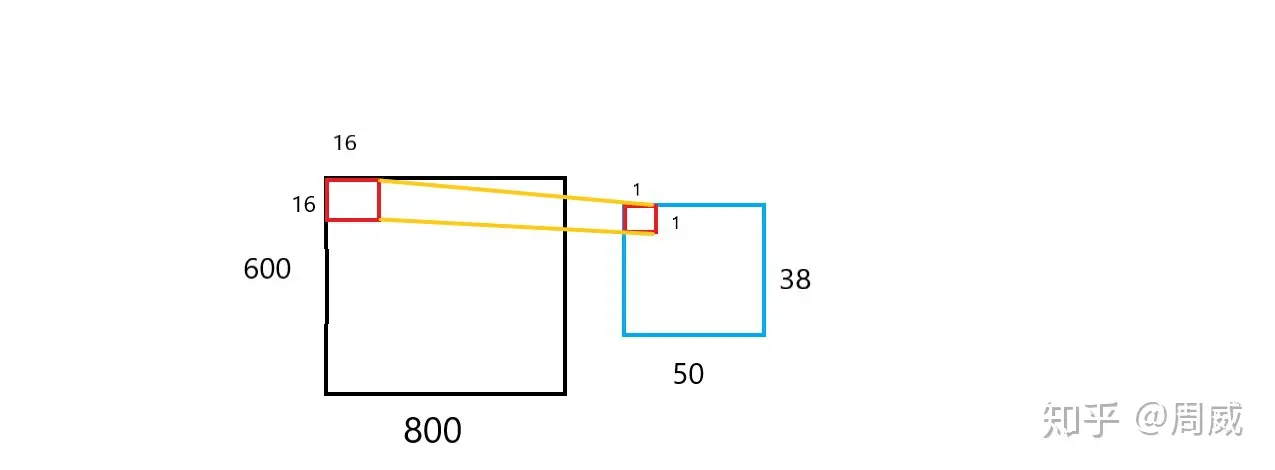
就是特征图上的每个点(大小为11)负责由原图对应区域(大小为1616)中心生成的9个anchor的训练和学习,(负责这一词,在YOLO中用得很多)
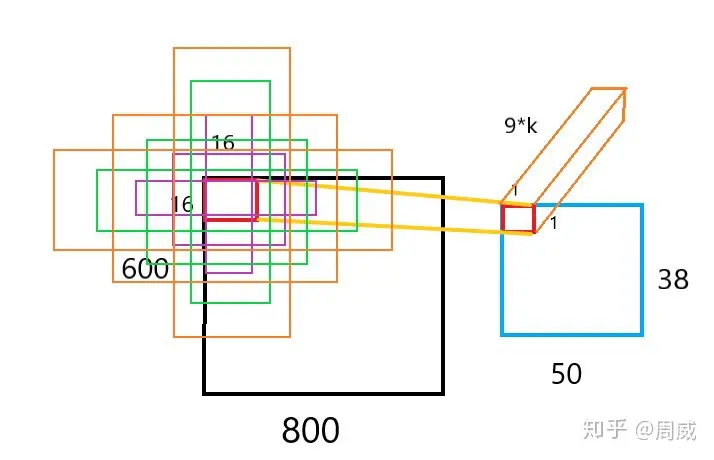
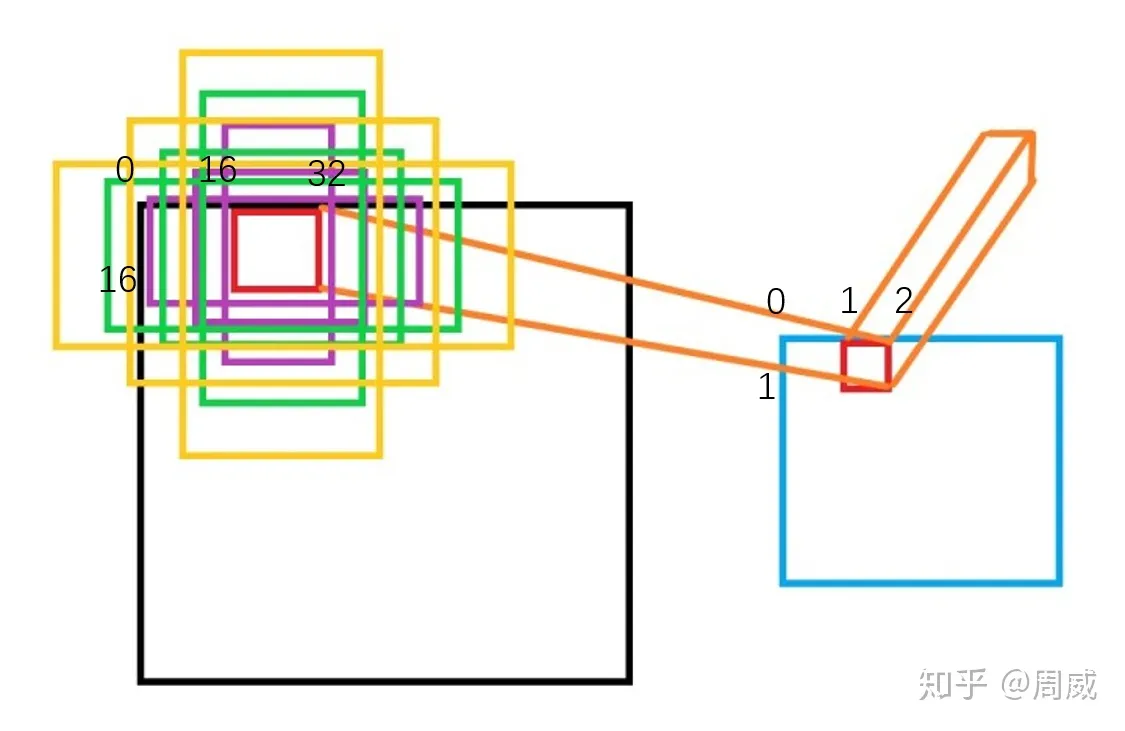
特征图的红框向右或向下滑动的时候,其对应的原图中的红框自然向右或向下移动
FasterRCNN共产生50x38x9=17100个anchor,基本覆盖了全图各个区域
在特征图中向右移动了一个小方格,则其在原图中对应的区域也向右移动了16个方格。但是anchor的大小和比例不变
#这个函数的意思大概就是将特征图上的锚返回到原图上
def generate_anchors_pre(height, width, feat_stride, anchor_scales=(8, 16, 32), anchor_ratios=(0.5, 1, 2)):
    """ A wrapper function to generate anchors given different scales
      Also return the number of anchors in variable 'length' 给定不同比例生成锚点的包装函数也返回可变“长度”的锚点数量
    """
    anchors = generate_anchors(ratios=np.array(anchor_ratios), scales=np.array(anchor_scales))
    A = anchors.shape[0] #anchor的数量,为9
    shift_x = np.arange(0, width) * feat_stride  #将特征图的宽度进行16倍延伸至原图,以width=4为例子,则shfit_x=[0,16,32,48]
    shift_y = np.arange(0, height) * feat_stride  #将特征图的高度进行16倍衍生至原图
    shift_x, shift_y = np.meshgrid(shift_x, shift_y)  #生成原图的网格点
    shifts = np.vstack((shift_x.ravel(), shift_y.ravel(), shift_x.ravel(), shift_y.ravel())).transpose()  #若width=50,height=38,生成(50*38)*4的数组
    #如 [[0,0,0,0],[16,0,16,0],[32,0,32,0].......],shift中的前两个坐标和后两个一样(保持右下和左上的坐标一样),是从左到右,从上到下的坐标点(映射到原图)
    K = shifts.shape[0]  #k=50*38
    # width changes faster, so here it is H, W, C
    anchors = anchors.reshape((1, A, 4)) + shifts.reshape((1, K, 4)).transpose((1, 0, 2))  #列数相同的list相加就是简单的添加,而数组不一样,1*9*4和(50*38)*1*4进行相加,生成了(50*38)*9*4的数组
    #其实意思就是右下角坐标和左上角的左边都加上同一个变换坐标
    anchors = anchors.reshape((K * A, 4)).astype(np.float32, copy=False) #三维变两维,(50*38*9,4),此处就是将特征层的anchor坐标转到原图上的区域
    length = np.int32(anchors.shape[0])  #length=50*38*9

    return anchors, length
shifts就是对(shift_x, shift_y)进行组合,其中shift_x是对x坐标进行移动,shift_y是对y坐标进行移动,综合起来就是将基础的中心为(7.5,7.5)的9个anchor平移到全图上
上述代码就是完成了9个base anchor 的移动,输出结果就是50389个anchor
那么到此,所有的anchor都生成了,当然了,所有的anchor也和特征图产生了一一对应的关系了
2. 画图
import matplotlib.pyplot as plt
import numpy
import numpy as np
fig = plt.figure()
ax = fig.add_subplot(111)
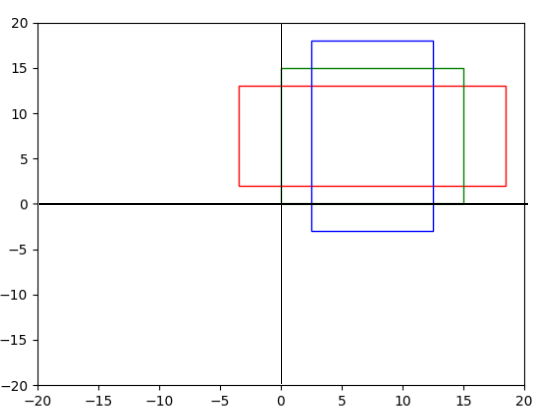
anchors = [[-3.5, 2, 18.5, 13],
[0, 0, 15, 15],
[2.5, - 3, 12.5, 18]]
cols = 'rgb'
for anch, col in zip(anchors, cols):
x1, y1, x2, y2 = anch
w = x2 - x1
h = y2 - y1
rect = plt.Rectangle((x1, y1), w, h, color=col, fill=False, linewidth=1)
ax.add_patch(rect)
ax.set_xlim([-20, 20])
ax.set_ylim([-20, 20])
plt.show()
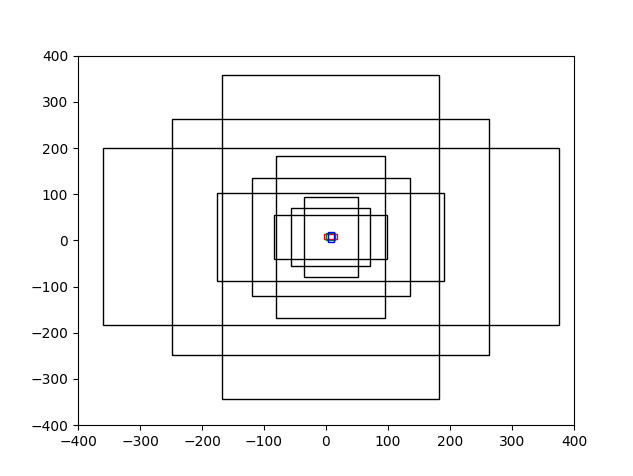
anchors2 = [[-84., -40., 99., 55.],
[-176., -88., 191., 103.],
[-360., -184., 375., 199.],
[-56., -56., 71., 71.],
[-120., -120., 135., 135.],
[-248., -248., 263., 263.],
[-36., -80., 51., 95.],
[-80., -168., 95., 183.],
[-168., -344., 183., 359.]]
for anch in anchors2:
x1, y1, x2, y2 = anch
w = x2 - x1
h = y2 - y1
rect = plt.Rectangle((x1, y1), w, h, color='black', fill=False,
linewidth=1)
ax.add_patch(rect)
ax.set_xlim([-400, 400])
ax.set_ylim([-400, 400])
plt.show()
anchor本质上是生成正负例样本 辅助训练RPN

 浙公网安备 33010602011771号